-
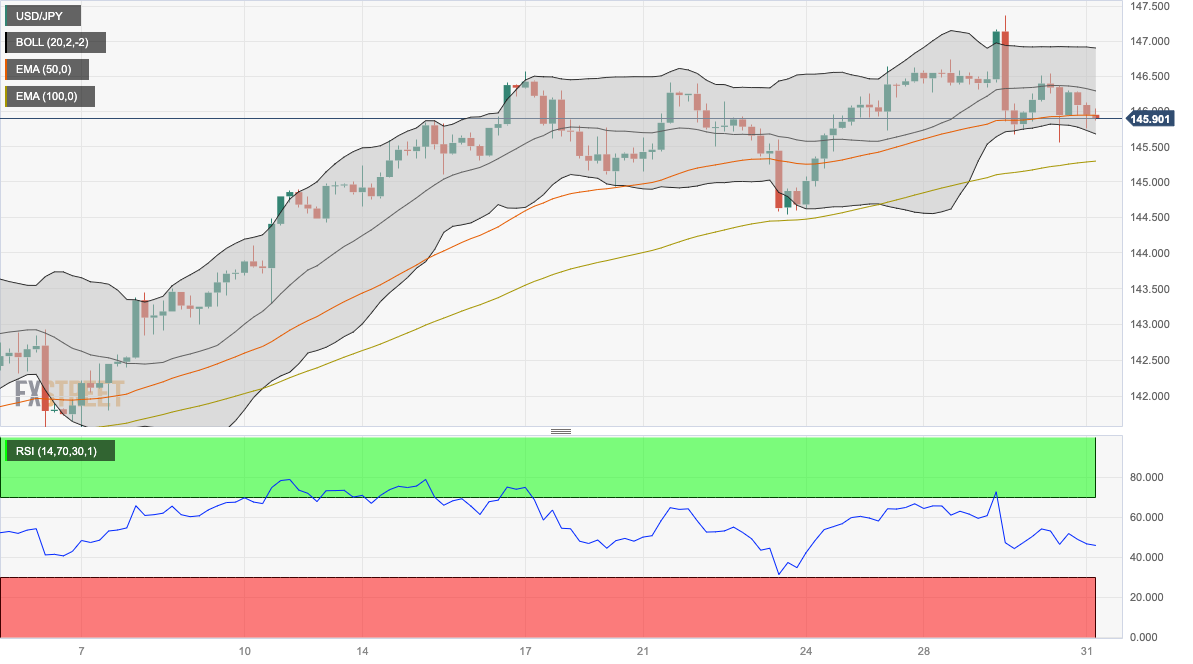
USD/JPY loses momentum around 145.90, stands above the key 100-hour EMA.
-
The Relative Strength Index (RSI) stands in bearish territory below 50.
-
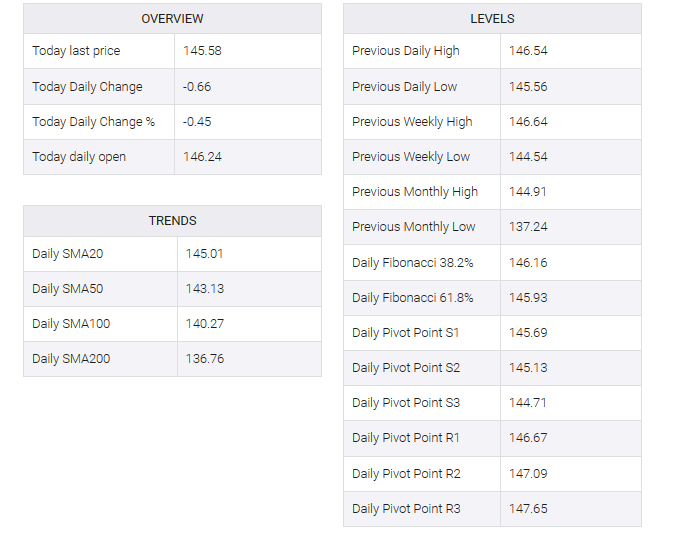
The immediate resistance level appears at 146.30; the first support level is located at 145.70.
The USD/JPY pair attracted some sellers in the early European session on Thursday. The major is currently trading near 145.90, losing 0.23% on the day. Markets were alert ahead of the release of the US Personal Consumption Expenditures (PCE) price index, the Federal Reserve’s (Fed) preferred gauge of inflation.
Moreover, Bank of Japan (BoJ) board member Toyoki Nakamura said on Thursday that policymakers need more time to transition to monetary tightening. The comment renewed pesky concerns about the BoJ and put pressure on the USD/JPY pair.
Regarding the data, Japanese retail sales rose 6.8% in July vs. 5.6% previously, better than expectations of 5.4%. Meanwhile, the country’s industrial production fell 2.0% MoM in July after a 2.4% increase in the previous month, compared to the market consensus of a 1.4% drop.
According to the four-hour chart, the USD/JPY pair is above the 100-hour exponential moving averages (EMAs) with an upward slope, which supports the buyers for now. However, the Relative Strength Index (RSI) stands in bearish territory below 50, indicating that a further downside cannot be ruled out.
Immediate resistance level for USD/JPY appears at 146.30 (midline of Bollinger bands). Any meaningful follow-through buying would see a rally to the boundary of the Bollinger Bands and a psychological round mark in the 146.90-147.00 region. Further north, the next hurdle to watch for USD/JPY is the year-to-date (YTD) high of 147.37, followed by 147.55 (November 2022 high) and 148.00 (a round figure).
On the flip side, the first support level is located near a lower limit of the Bollinger Band at 145.70. The next contention level is seen at 145.30 (100-hour EMA). Any intraday pullback below the latter would expose the next critical downside stop at 145.00 (a psychological round mark) and finally at 144.55 (a low of August 23).
USD/JPY four-hour chart
USD/JPY