-
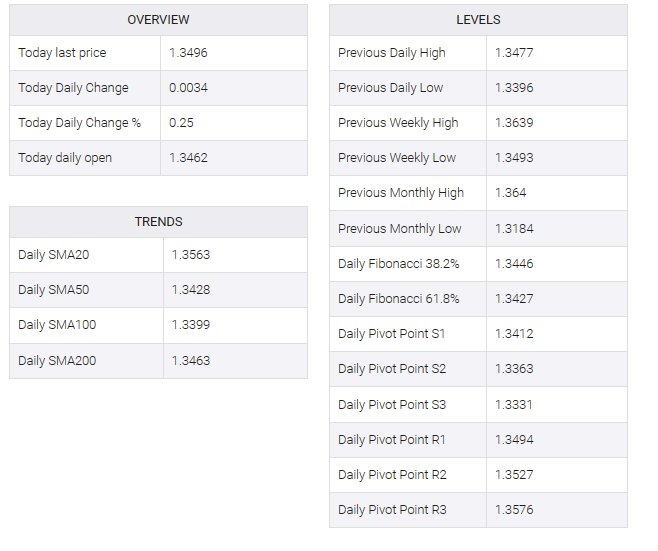
USD/CAD gains traction near the 1.3500 psychological mark amid the renewed USD.
-
The pair holds below the 50- and 100-hour EMAs; Relative Strength Index (RSI) stands in bullish territory above 50.
-
The first resistance level is seen at 1.3510; the initial support level is located at 1.3465.
The USD/CAD pair traded in positive territory for the second consecutive day in the early European session on Thursday. The pair’s recovery was bolstered by the Federal Reserve’s (Fed) hawkish stance after it kept interest rates unchanged at its policy meeting on Wednesday. Additionally, the fall in oil prices weighed on the commodity-related loonie as the country is the leading oil exporter to the US. The pair is currently trading near 1.3495, up 0.26% on the day.
According to the four-hour chart, USD/CAD is with a downward slope below the 50- and 100-hour exponential moving averages (EMAs), which supports sellers for now.
The first resistance level for the pair is seen near the 50-hour EMA at 1.3510. An additional upside filter to watch is near the confluence of the 100-hour EMA and the upper boundary of the Bollinger Bands at 1.3530. Any follow-through buying above the latter would pave the way to the September 13 high of 1.3586, followed by a psychological round figure at 1.3600.
On the downside, the primary support level is located at 1.3465 (September 20 high). The critical resistance is seen in the 1.3400-1.3410 region, which represents a psychological figure, the lower limit of the Bollinger Bands and the August 11 low. Further south, the next downside stop would appear at 1.3380 (September 19 low).
It’s worth noting that the Relative Strength Index (RSI) stands above 50, activating the bullish momentum for the USD/CAD pair for the USD/CAD pair.


