-
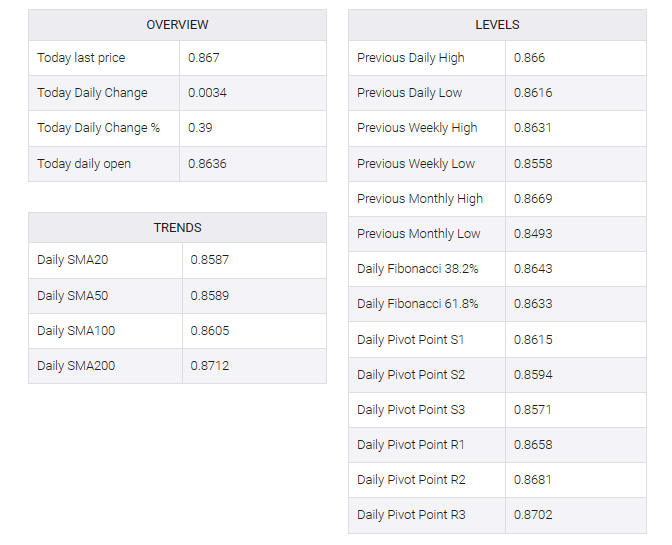
EUR/GBP closed Thursday at 0.8670, up by 0.20%, hitting a daily high of 0.8695 near the 200-day SMA.
-
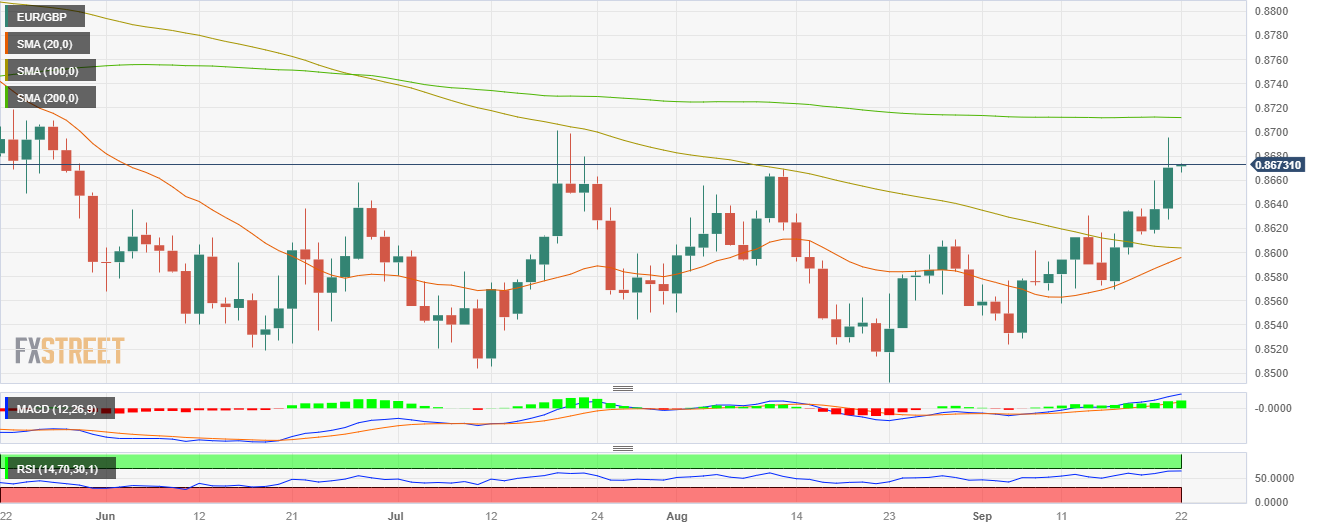
The daily and four-hour chart flashes bullish signals.
-
The 20-day SMA and 100-day SMA are about to perform a bullish cross on the daily chart.
On Thursday, the EUR/GBP cross gained more momentum, closing towards the 0.8670 area and already up 1.34% in September.
In line with that, the daily chart indicates that the technical outlook is more bullish than bearish. The Relative Strength Index (RSI) and Moving Average Convergence Divergence (MACD) are comfortably placed in positive territory on the daily chart. Moreover, the pair is above the 20- and 100-day simple moving averages (SMAs), but below the 200-day SMA, implying that bears struggle to challenge the overall bullish trend. Traders should focus on the 20 and 100-day moving averages converging towards the 0.8600 area, which looks set to execute a bullish cross, which could increase buying momentum.
On the four-hour chart, technical indicators also point to a clear dominance of the bulls, with the RSI printing a slight upward slope near the 70 threshold while the MACD is displaying flat green bars.
Support levels: 0.8630, 0.8600 (20 and 100-day SMA convergence), 0.8570.
Resistance Levels: 0.8700, 0.8710 (200-day SMA), 0.8750.
EUR/GBP Daily chart
EUR/GBP