-
USD/CAD could achieve the 1.3850 psychological level followed by the previous week’s high.
-
Technical indicators suggest bullish momentum to revisit the yearly high at 1.3898 level.
-
The psychological level at 1.3800 emerges as the immediate support followed by the 14-day EMA.
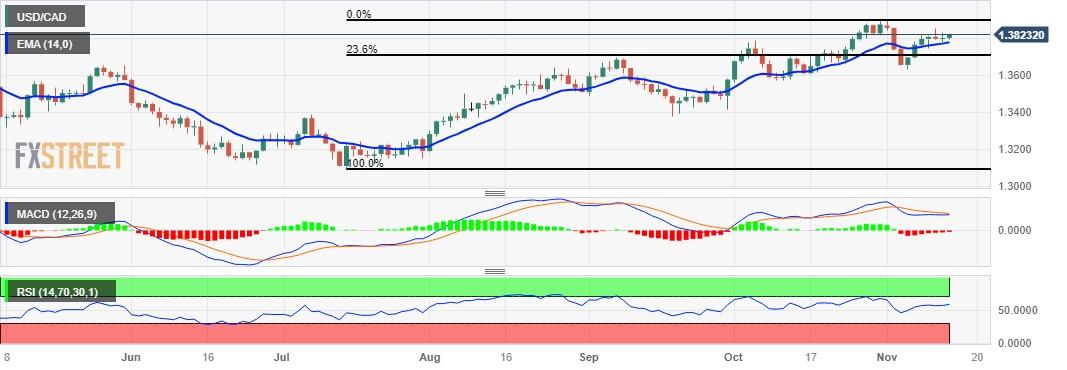
USD/CAD bids higher near 1.3820 during the early European session on Tuesday, followed by an immediate resistance zone near 1.3850 aligning with the previous week’s high at the 1.3854 level.
The 14-day Relative Strength Index (RSI) is hovering above the 50 level, indicating upside support. This signals a bullish momentum and reflects a strong market sentiment.
The Moving Average Convergence Divergence (MACD) line is above the centerline but shows convergence below the signal line, suggesting a possible momentum shift towards bearish sentiment in the USD/CAD pair.
With market participants taking a cautious stance ahead of US inflation data, the US dollar (USD) could rise more than expected and in turn, the USD/CAD pair could recover to annual highs at the 1.3898 level.
On the downside, USD/CAD could meet key support around the psychological level at 1.3800, followed by the 14-day exponential moving average (EMA) at 1.3778. A decisive break below the latter could force the USD/CAD pair to navigate the territory near the 23.6% Fibonacci retracement level aligned at 1.3706.
USD/CAD: Daily Chart
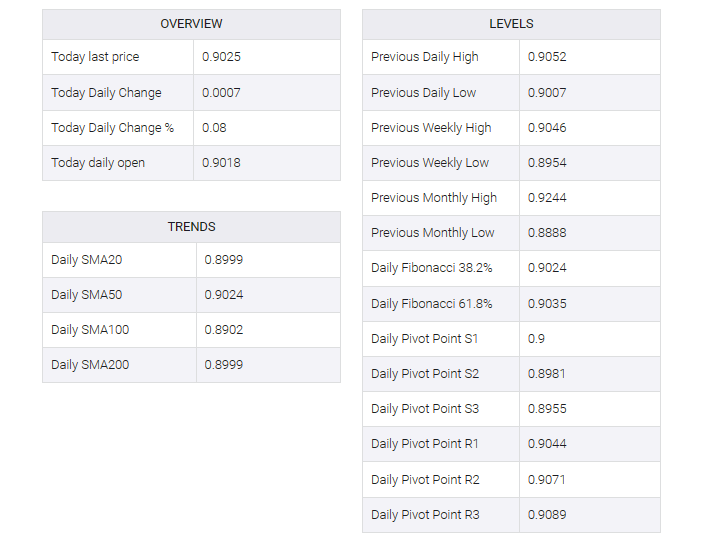
USD/CAD: OTHER TECHNICAL LEVELS TO WATCH