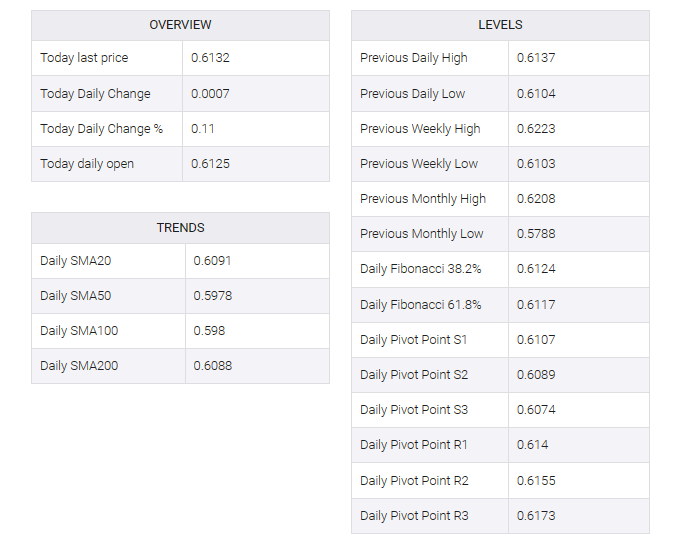
-
NZD/USD continues to hold above 0.6100 with limited pullback.
-
NZ GDP to be overshadowed by Fed’s last meeting of 2023.
-
Fed dot plot to be the key highlight for Wednesday.
The NZD/USD continues to cycle in a rough range between 0.6100 and 0.6180 in a sideways grind that has kept the pair strung in place for December trading.
New Zealand’s gross domestic product (GDP) for the third quarter will be released in Thursday’s first session, but before that the NZD/USD pair is set to run first on Wednesday’s Federal Reserve (Fed) rate call, and broader markets on the US central bank’s interest rate outlook. Shifting to concentrate.
The Federal Reserve will release their updated dot plot, the Fed’s own interest rate estimates, and global markets eager for a ‘sooner than later’ path to Fed rate cuts will be looking closely at the dot plot to see if the Fed’s rate outlook matches investor expectations. Markets currently expect the Fed to fight the rate cut cycle as soon as the end of the first quarter in 2024.
The Fed is expected to keep rates flat at 5.5% for its final rate call in 2023, but investors will be keeping a close eye on the Fed’s monetary policy statement to gauge whether the Fed is leaning toward a dovish or dovish stance.
New Zealand’s GDP is expected to soften considerably, with QoQ GDP growth forecast to decline from 0.9% to 0.2%, and the annual figure expected to return to 1.8% to 0.5% as the New Zealand economy edges into recession.
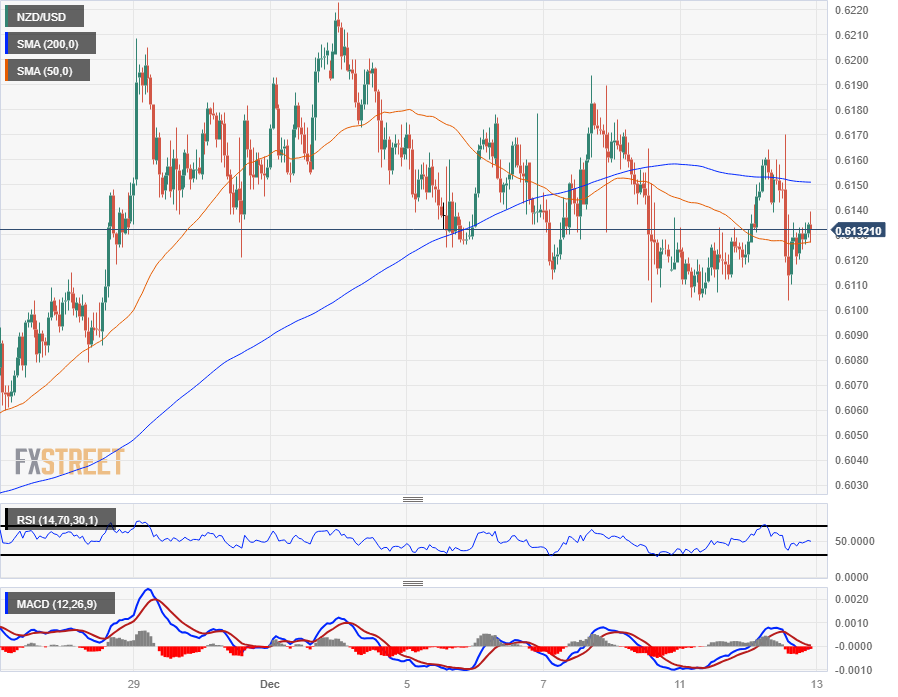
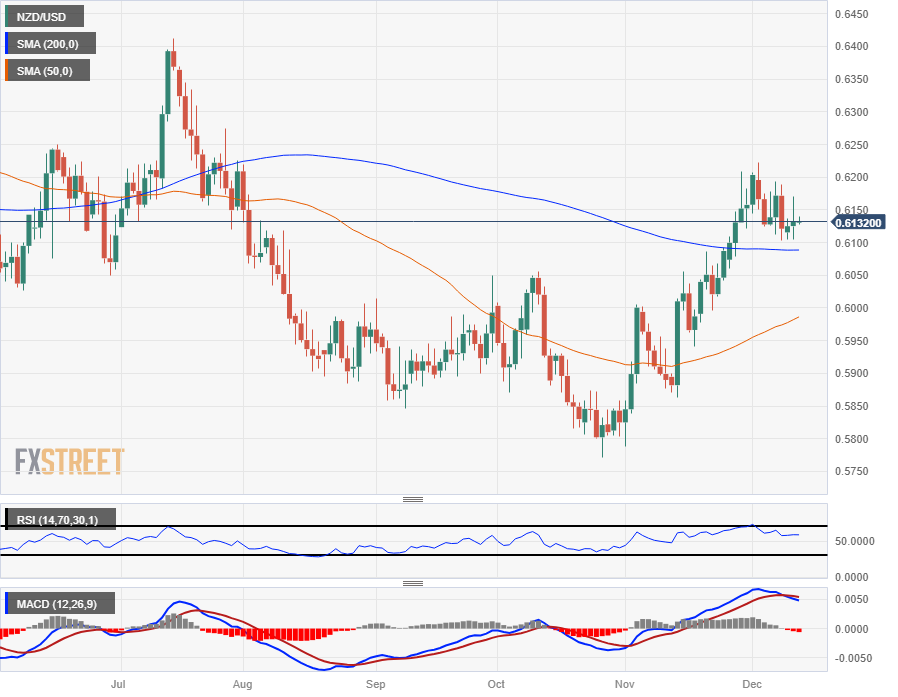
NZD/USD Technical Outlook
The Kiwi’s intraday action sees the NZD/USD capped by the 200-hour Simple Moving Average (SMA) near 0.6150, and near-term chart action has been largely constrained into the midrange.
Despite the NZD/USD’s near-term flat trading, the pair remains on the high side of the 200-day SMA, buoyed above the 0.6100 handle and the pair has seen little pullback after getting vaulted from year-long lows near 0.5800 in late October.
The 50-day SMA is accelerating towards bullish territory, pushing into the 0.6000 major handle as bids remain pinned in high ground.
NZD/USD Hourly Chart
NZD/USD Daily Chart
NZD/USD Technical Levels
NZD/USD