-
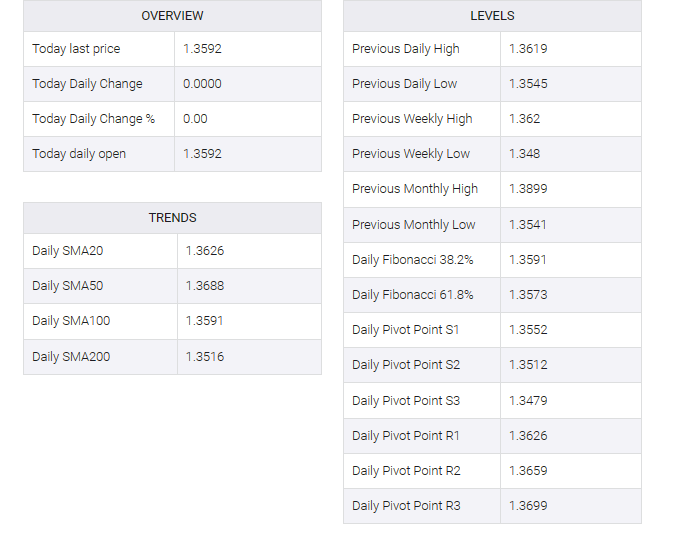
USD/CAD grapples to extend its gains on the back of subdued Crude oil prices.
-
A firm breakthrough above 1.3600 could lead the pair to reach a 21-day EMA at 1.3620.
-
14-day RSI lies below the 50 mark; the 1.3550 level could act as key support.
USD/CAD is struggling to extend its gains for a second straight day while the US Dollar (USD) remains in positive territory. Crude oil prices strengthen downward pressure on the Canadian dollar (CAD). The USD/CAD pair traded higher around 1.3590 during the European session on Wednesday.
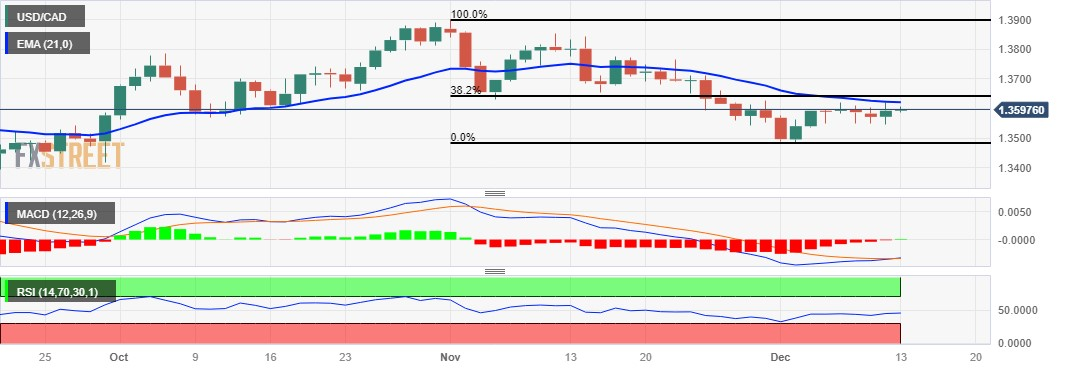
The USD/CAD pair finds the psychological level at 1.3600 as a key resistance. A firm break above the latter could motivate bulls in the USD/CAD pair to explore the 21-day exponential moving average (EMA) at 1.3620 followed by the 38.2% Fibonacci retracement level at 1.3840 before major resistance at the 1.3650 level.
The technical indicator Moving Average Convergence Divergence (MACD) for the USD/CAD pair indicates a potential bullish trend reversal. The MACD line lies below the centerline and crosses above the signal line. The crossover above the signal line suggests that the short-term moving average is gaining strength compared to the long-term moving average, indicating a shift towards positive momentum in the pair.
However, the analysis suggests a mixed sentiment for the USD/CAD pair with the 14-day Relative Strength Index (RSI) below 50. This indicates the weakness of this pair and it may lose ground. The mentioned support level, with key levels around 1.3550 and psychological support at 1.3500, are important markers to watch.
If the USD/CAD pair breaks below the latter, it could face further bearish pressure, potentially navigating towards the region near the previous week’s low of 1.3480.
USD/CAD: Daily Chart
USD/CAD: MORE TECHNICAL LEVELS