-
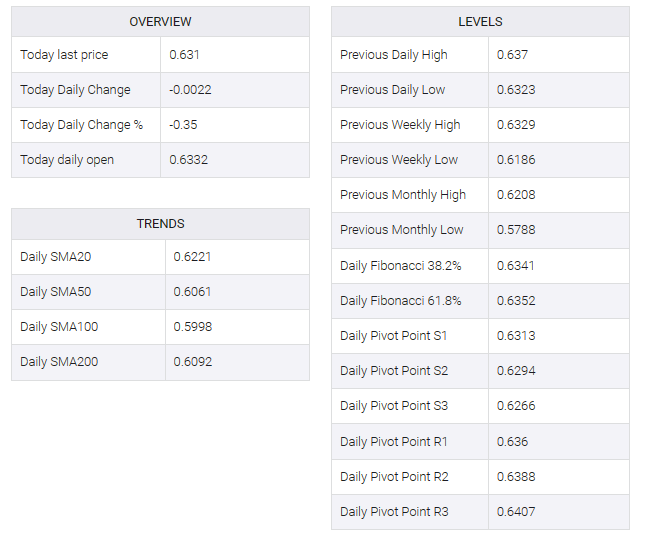
NZD/USD drops gradually from 0.6360 amid recovery in the US Dollar.
-
Investors see the Fed reducing interest rates from March 2024.
-
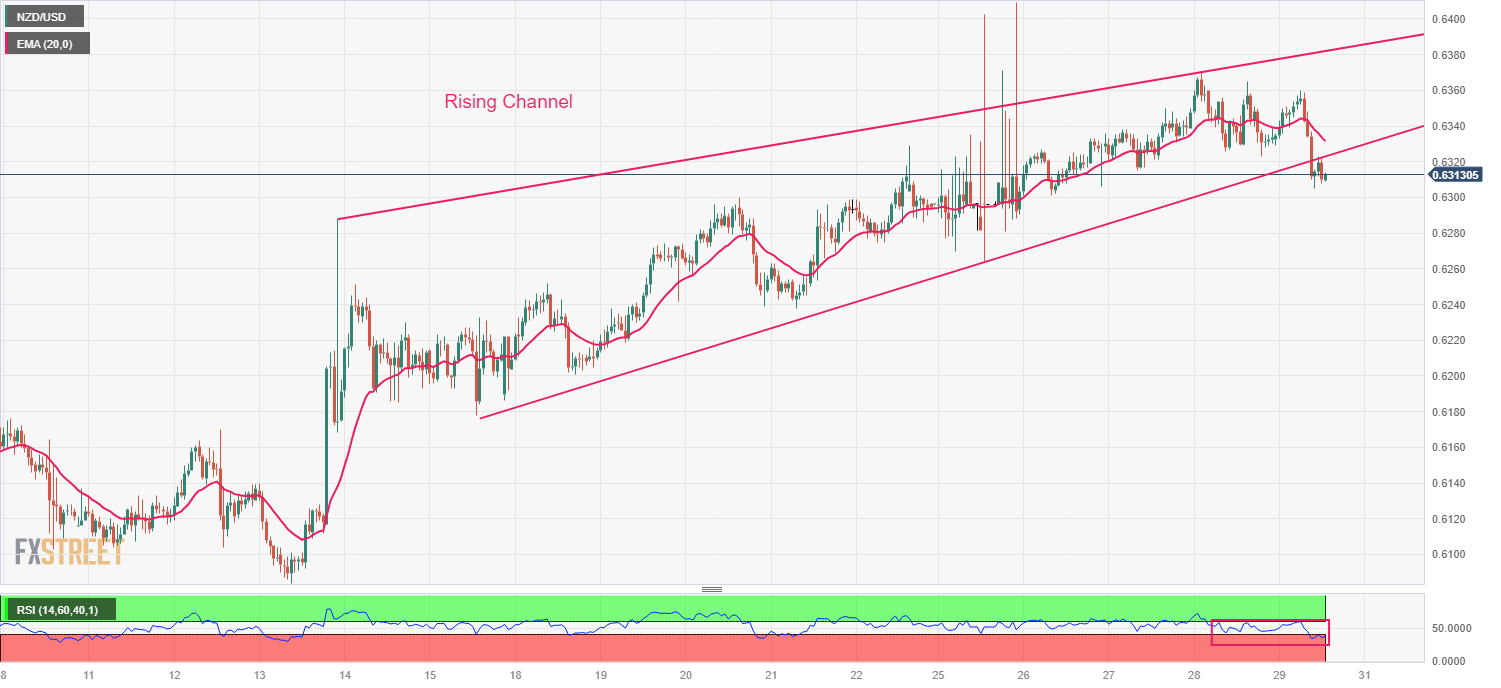
NZD/USD delivers a breakdown of the upward-sloping chart pattern.
The NZD/USD pair faces nominal selling near 0.6360 as the US Dollar attempts a recovery move despite thin trading activity. Kiwi assets have struggled to boost recovery as market participants’ high risk-appetite fades.
The US dollar index (DXY) is nearing 101.20 but broad appeal is still bearish as investors expect the Federal Reserve (Fed) to start cutting interest rates from March 2024. Consistently easing price pressures and labor market conditions will allow Fed policymakers to approve rate cut decisions.
Next week, further moves in the US dollar will be driven by manufacturing PMI and December employment data. The New Zealand dollar will take effect due to the release of Caixin manufacturing PMI data for December.
NZD/USD is at a make or break level near 0.6300. The resource provides a breakdown of the rising channel chart pattern formed on an hourly scale. The 20-period exponential moving average (EMA) has started to decline, indicating that the near-term trend has turned bearish.
A range shift from the bullish region of 40.00-80.00 to the region of 20.00-60.00 by the Relative Strength Index (RSI) (14) indicates a bearish momentum.
Fresh downside move appear if the asset drops below December 25 low at 0.6246. This would expose the asset to November 29 high at 0.6208 and December 14 low at 0.6168.
In an alternate scenario, a recovery move above December 28 high of 0.6370 would drive the asset towards December 26 high near 0.6410. Breach of the latter would open upside for February 2 near 0.6463.
NZD/USD hourly chart
NZD/USD