-
USD/CAD consolidates below 1.3400 as investors await the US Inflation data.
-
Bets in favour of rate cuts from the Fed in March may deepen if the US CPI report turns out sticky.
-
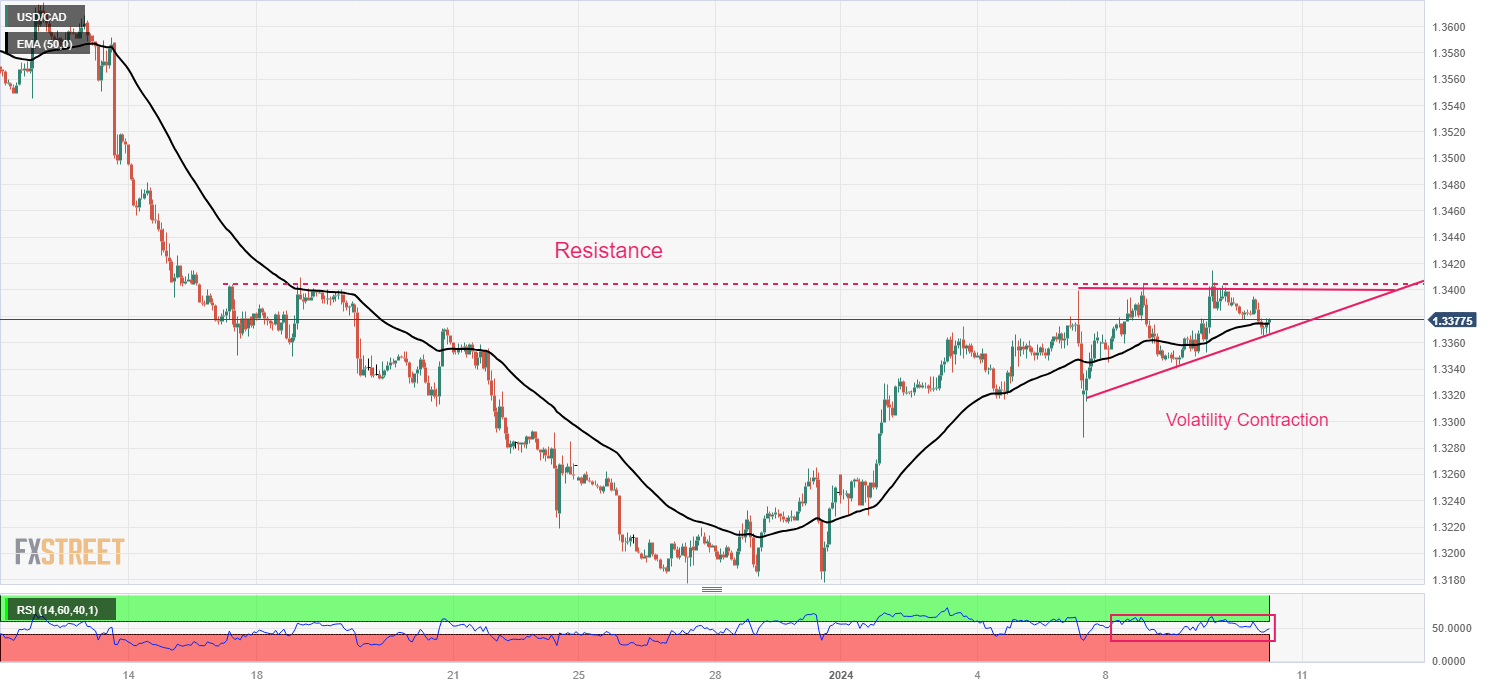
USD/CAD reflects a volatility contraction pattern formation.
The USD/CAD pair falls slightly to near 1.370 after failing to sustain above the round-level resistance of 1.3400. The Loonie asset demonstrates a sheer consolidation as investors shift focus towards the United States inflation data for December, which will be published on Thursday.
S&P500 futures struggle to hold on to gains as market mood remains cautious. The US Dollar Index (DXY) is near 102.44 despite continued uncertainty over a rate cut by the Federal Reserve (Fed). The 10-year US Treasury yield fell slightly below 4.0%.
Investors will be keenly watching US inflation data as it gives fresh hints about a possible rate cut by the Federal Reserve (Fed) in March. Headline inflation rose 0.2% against a 0.1% rise in November, according to estimates. The annual headline Consumer Price Index (CPI) rose 3.2% from a 3.1% increase a month earlier.
Meanwhile, core inflation increased steadily on a monthly basis. Annual core CPI data declined to 3.8% against the previous reading of 4.0%.
USD/CAD struggles for a direction within a volatility contraction pattern forming on the hourly scale near 1.3400. A sharp drop in volatility in the absence of a potential trigger indicates indecision among market participants. The horizontal resistance plotted since December 15 near 1.3405 continues to act as a barricade for US dollar bulls.
The 50-period exponential moving average (EMA) near 1.3380 continues to provide support to the US dollar.
The Relative Strength Index (RSI) (14) oscillates in a 40.00-60.00 range, indicating forward consolidation.
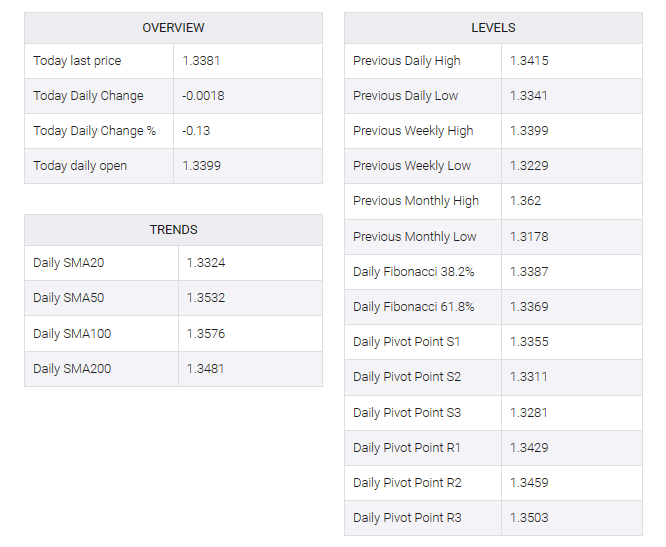
If the Loonie asset breaks above the high of 1.3415 on January 9, it will show fresh upside. It will open to the upside at the December 3 low of 1.3480, followed by a December 5 low of 1.3540.
On the flip side, a downside move below January 5 low at 1.3288 would expose the asset to December 22 low at 1.3220. Breach of the latter would build more pressure on the asset and will drag it towards December 27 low at 1.3177.
USD/CAD hourly chart
USD/CAD