-
USD/JPY gains positive traction for the second day in a row and inches closer to weekly highs.
-
The widening US-Japan yields differential, and the risk-on impulse undermine the safe-haven JPY.
-
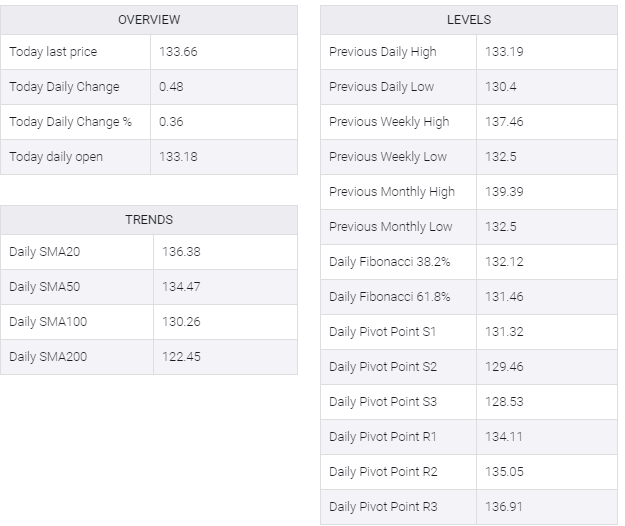
Bulls facing tough resistance from the 50-day SMA at 134.60, should await clean break before placing fresh bets.
The USD/JPY pair catches fresh bids near the 132.30-132.25 region and steadily climbs back closer to the weekly high set earlier this Wednesday. The pair is currently trading around the 133.65-133.70 area, up nearly 0.40% for the day and is supported by a combination of factors.
A further rise in the US Treasury bond yields, bolstered by the overnight hawkish remarks by several Fed officials, widens the US-Japan rate differential. This, along with the risk-on impulse, undermines the safe-haven Japanese yen and pushes the USD/JPY higher for the second successive day.
Looking at the broader picture, Tuesday’s post-FOMC sharp decline has stalled near the 130.40-130.35 confluence support. The mentioned area contains the 100-day SMA and the 50% Fibonacci retracement level of the April-July rally, which will now serve as a key point for the USD/JPY pair.
Bullish traders, meanwhile, struggled to make much progress above 134.00 after encountering tough resistance at the 50-day SMA at 134.60. If they break above the 135.00 psychological mark, the next hurdle is on the way to the 23.6% Fibo. level, near the 135.00 area.
On the flip side, the 38.2% Fibo. level, around the 132.50 area, now seems to protect the immediate downside ahead of the 132.00 round figure and the 131.65-131.60 region. Failure to defend the said support levels could make the USD/JPY pair vulnerable to sliding back below the 131.00 mark.
The downward trajectory could further get extended towards the 130.40-130.35 confluence support. A convincing break below the latter would be seen as a fresh trigger for bears and set the stage for an extension of the recent corrective slide from the 24-year peak touched on July 14.
USD/JPY daily chart

Key levels to watch