-
USD/CAD holds lower grounds near 2.5-month bottom, fades bounce off 200-EMA of late.
-
A clear downside break of short-term key support lines favors sellers.
-
50-EMA holds the key to bull’s conviction, 1.3700 appears a tough nut to crack for them.
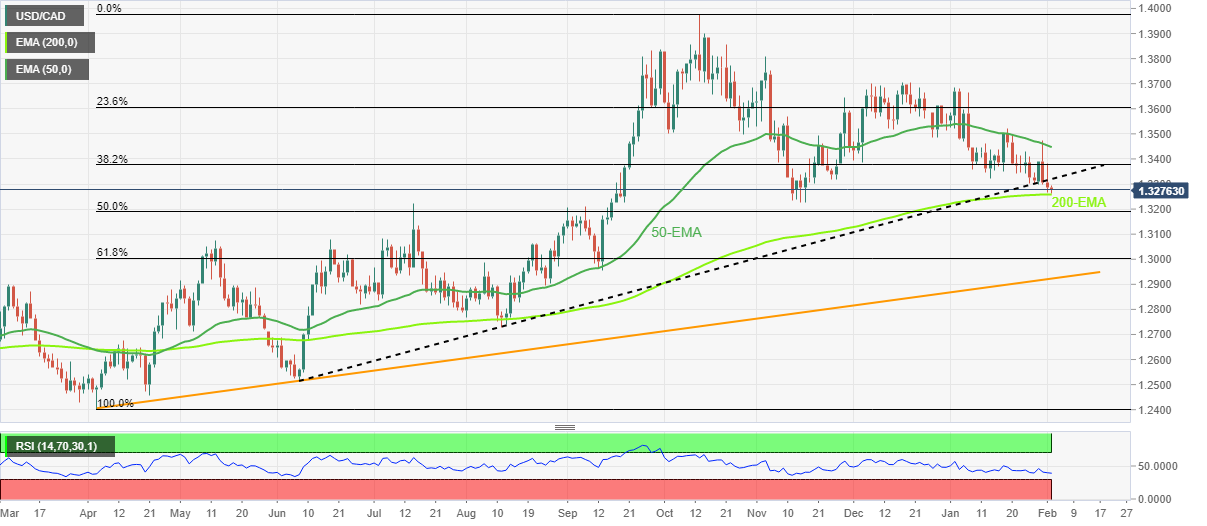
USD/CAD remains pressured around the lowest levels since mid-November 2022 as it pokes the 200-day Exponential Moving Average (EMA) during early Thursday. In doing so, the Loonie pair prints mild losses during the three-day losing streak.
It’s worth noting that the quote’s sustained trading below the 50-EMA and a clear break of the eight-month-old ascending support line seems to keep the USD/CAD bears hopeful. Also favoring the sellers is the absence of an oversold RSI (14) line.
That said, the Loonie pair bears are very much capable of breaking the aforementioned key 200-EMA support surrounding 1.3260.
However, multiple levels marked since July 2022, surrounding 1.3230-20, portray strong support for the USD/CAD sellers to break if they wish to keep the reins.
Following that, a 61.8% Fibonacci retracement of the pair’s April-October 2022 run-up near the 1.3000 psychological magnet will be a crucial level to lure the USD/CAD bears.
On the contrary, a daily closing beyond the support-turned-resistance line from June 2022, close to 1.3320 by the press time, could activate the pair’s corrective bounce.
Even so, the USD/CAD bulls are likely to remain skeptical unless witnessing a daily closing beyond the 50-EMA level surrounding 1.3450.
In a case where the quote crosses the 1.3450 hurdle, the odds of its rally toward the multiple hurdles nearing 1.3700 can’t be ruled out.
USD/CAD: Daily chart
Trend: Further downside expected
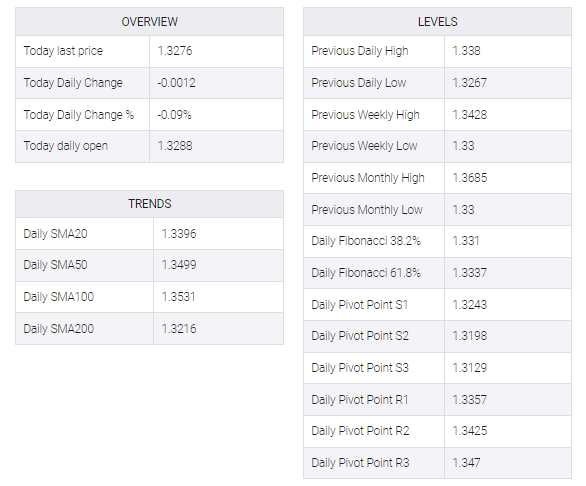
ADDITIONAL IMPORTANT LEVELS