-
USD/CHF picks up bids to refresh intraday high, extend the previous day’s bounce off one-week low.
-
Bullish MACD signal, sustained trading beyond 200-HMA in bullish chart formation favors buyers.
-
Sellers need to conquer the golden Fibonacci ratio to retake control.
USD/CHF stands on a firmer footing near 0.9225 while refreshing intraday high during early Wednesday. In doing so, the Swiss Franc (CHF) pair stretches the previous day’s rebound from the lowest level in a week with a one-week-old bullish triangle formation.
Adding strength to the upside bias is the quote’s latest bounce off the 200-Hour Moving Average (HMA), around 0.9215 by the press time, as well as the bullish MACD signals.
That said, the USD/CHF pair’s current advances aim for the top line of the stated triangle, close to 0.9250 at the latest.
Should the bulls manage to cross the key upside hurdle, the odds of witnessing further run-up towards the monthly high of 0.9291 and then to the 0.9300 threshold can’t be ruled out.
It’s worth observing that the USD/CHF rise beyond 0.9300 won’t hesitate to challenge January’s peak of 0.9409.
Conversely, a clear break of the 200-HMA level around 0.9215 is not an open invitation for bears as the 0.9200 round figure could probe a negative move.
Nevertheless, the USD/CHF pair’s Feb 02-06 50% Fibonacci retracement level and the bottom line of the above-mentioned triangle, near 0.9175 and 0.9160, respectively, could probe the bears.
In a case where the USD/CHF sellers keep the reins past 0.9160, the 61.8% Fibonacci retracement level of .9147, also known as the golden Fibonacci ratio, can be considered the last defense of the pair buyers.
USD/CHF: Hourly chart

Trend: Further upside expected
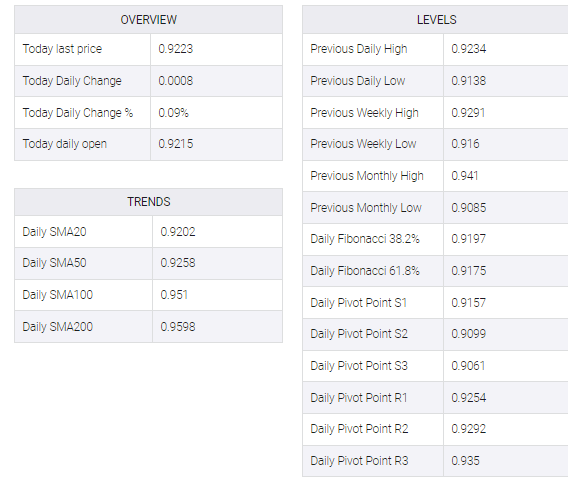
ADDITIONAL IMPORTANT LEVELS