
AUD/USD Outlook
AUD/USD continues to hold below the monthly high (0.6784) as it gives back the advance following the Federal Reserve interest rate decision, and the exchange rate may track the negative slope in the 200-Day SMA (0.6759) as a bear flag takes shape.
AUD/USD rate forecast: bear flag takes shape
AUD/USD holds within yesterday’s range amid the failed attempts to push above the long-term moving average, and the exchange rate may reestablish the downward trend from earlier this year if struggles to retain the advance from the yearly low (0.6565).
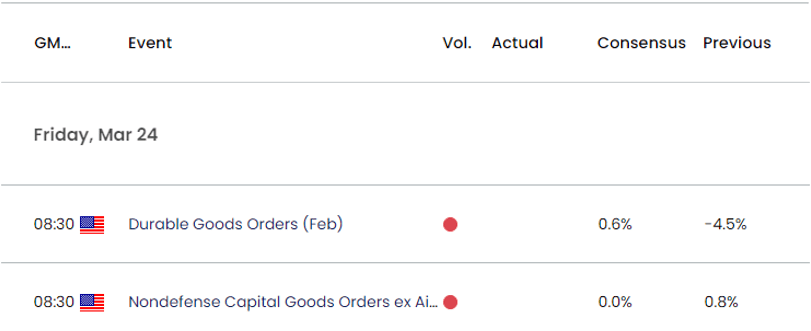
Looking ahead, the update to the US Durable Goods Orders report may drag on AUD/USD as demand for large-ticket items are expected to increase 0.6% in February, and a positive development may push the Federal Reserve to further combat inflation as the central bank reiterates that the ‘labor market remains extremely tight.’
In turn, the Federal Open Market Committee (FOMC) may keep the door open to pursue a more restrictive policy, and the central bank may deliver another 25bp rate hike as Chairman Jerome Powell and Co. ‘now anticipate that some additional policy firming may be appropriate.’
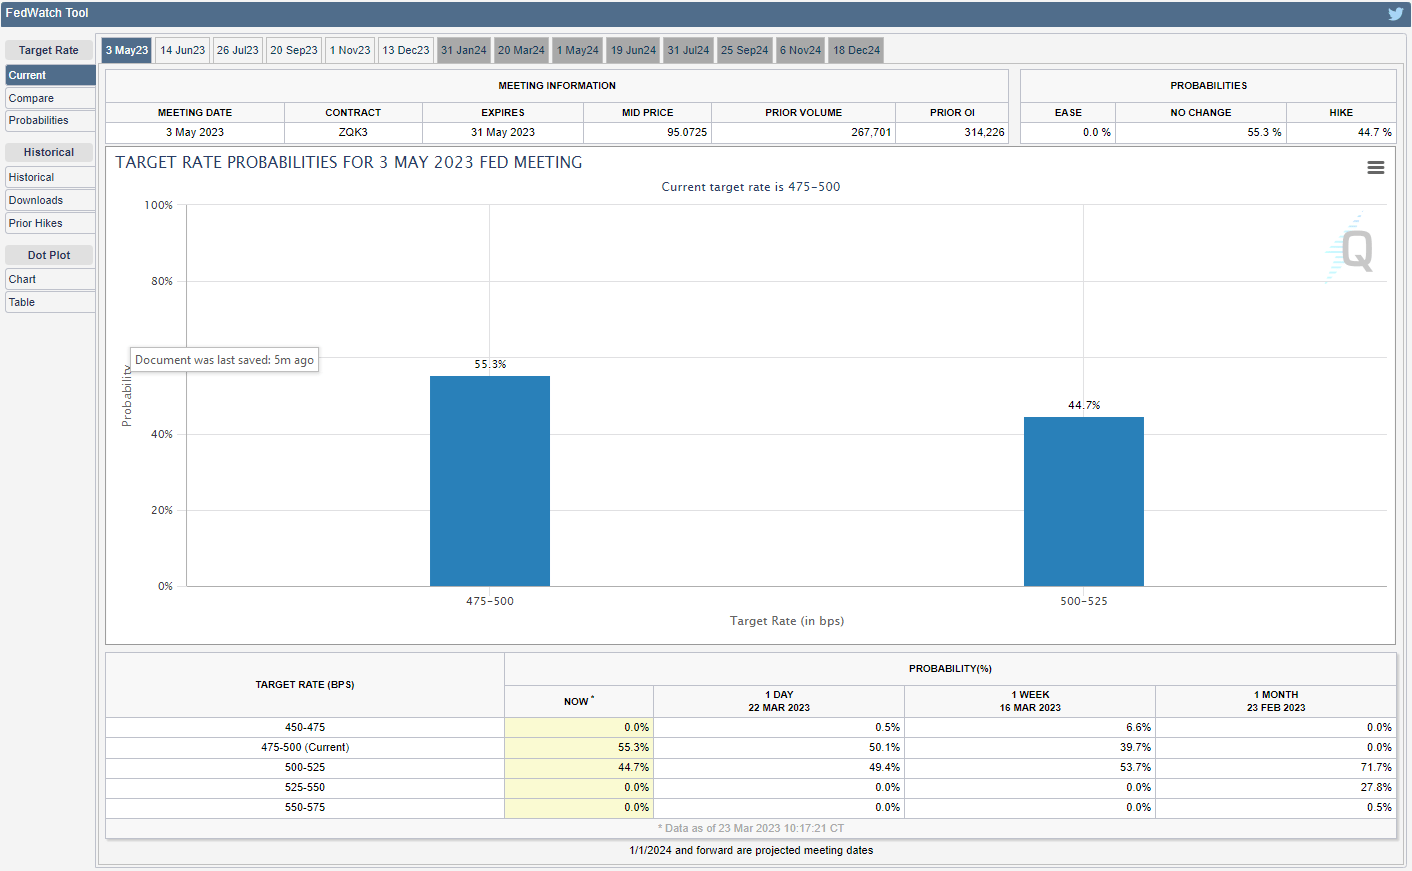
Source: CME
However, market participants appear to be bracing for a change in regime at the next interest rate decision on May 3 as the CME FedWatch Tool reflects a greater than 50% probability for US rates to stay on hold.
Until then, developments coming out of the US may sway AUD/USD as the Fed acknowledges that ‘economic indicators have generally come in stronger than expected,’ but further threats to financial stability may influence the monetary policy outlook as the central bank pledges to ‘carefully assess the actual and expected effects of tighter credit conditions.
With that said, a rebound in US Durable Goods Orders may curb the recent rebound in AUD/USD as it would allow the FOMC to implement a more restrictive policy, and the exchange rate may track the negative slope in the 200-Day SMA (0.6759) as a bear flag takes shape.
Australian Dollar Price Chart – AUD/USD Daily
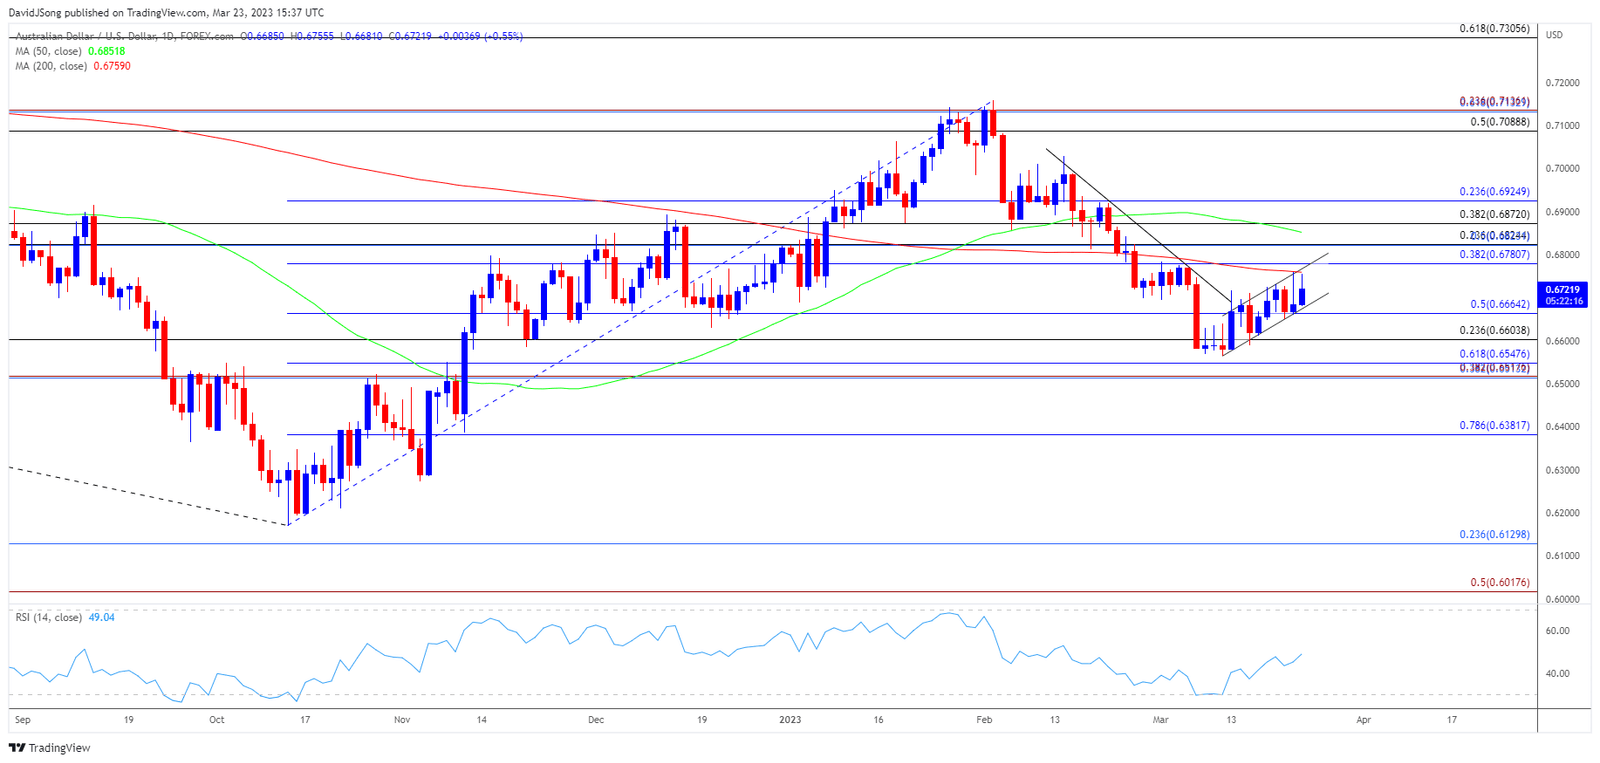
Chart Prepared by David Song, Strategist; AUD/USD on TradingView
- AUD/USD holds below the monthly high (0.6784) as it struggles to push above the 200-Day SMA (0.6759), and the exchange rate may track the negative slope in the moving average as a bear-flag takes shape.
- Failure to clear the long-term moving average may push AUD/USD back towards 0.6660 (50% Fibonacci retracement), with a move below the 0.6600 (23.6% Fibonacci retracement) handle bringing the yearly low (0.6565) on the radar.
- However, a break above the monthly high (0.6784) would negate the continuation pattern, with a close above the 0.6780 (38.2% Fibonacci retracement) to 0.6820 (23.6% Fibonacci retracement) region raising the scope for a test of the 50-Day SMA (0.6852).
— Written by David Song, Strategist