-
The AUD/USD is oscillating around the 0.6580 level, reflecting a decline of 0.25%.
-
US Labor market data from November showed that wages and job creation increased while Unemployment declined.
-
US bond yields made the US Dollar gain interest.
The Aussie dollar (AUD) experienced a dip in its Friday trading session, with the AUD/USD trading lower at approximately 0.6580. The downward movement can primarily be attributed to robust American labor market data, coupled with escalating U.S. yields, which drove demand to the Greenaback
US Bureau of Labor Statistics data indicated that average hourly earnings rose 0.4% MoM in November, topping the 0.3% expected and 0.2% previously. Moreover, US nonfarm payrolls surprisingly rose to 199K in November from 150K earlier, beating forecasts for 180K, while the unemployment rate fell to 3.7% from 3.9%.
In response, US Treasury yields are rising. The 2-year rate is at 4.70%, while the 5- and 10-year rates are trading at 4.24% and 4.25%, respectively, favoring a strengthening USD. In that sense, the strong employment figures fueled speculation surrounding the Federal Reserve’s monetary policy on how long the bank would keep rates at capped levels. It’s worth noting that Fed officials left the door open for more tightening because they haven’t seen enough evidence of the economy cooling, so stronger data could delay rate cuts.
Next week, the US will release Consumer Price Index (CPI) figures from November, which markets will be watching closely.
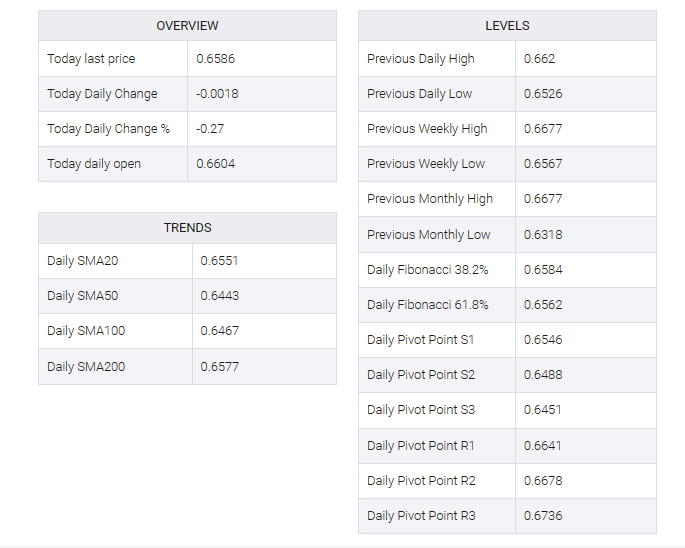
AUD/USD levels to watch
The AUD/USD daily chart is delivering mixed signals. Despite the negative slope in the Relative Strength Index (RSI) indicating lowered buying momentum in the short term, the indicator is still within the positive territory, suggesting that, overall, bullish sentiment has not entirely dissipated. However, the Moving Average Convergence Divergence (MACD) prints rising red bars, indicating growing bearish momentum.
Although bears appear to be gaining ground recently, the index’s placement above its 20-day, 100-day, and 200-day Simple Moving Averages (SMAs) can’t be overlooked. This position illustrates that despite short-term selling pressures, the overall trend remains bullish, indicating that the latter maintains a stronghold in the wider context in this tug-of-war between bears and bulls.
Support Levels: 0.6575 (200-day SMA), 0.6560 (20-day SMA), 0.6530.
Resistance Levels: 0.6600, 0.6630, 0.6650.
AUD/USD daily chart
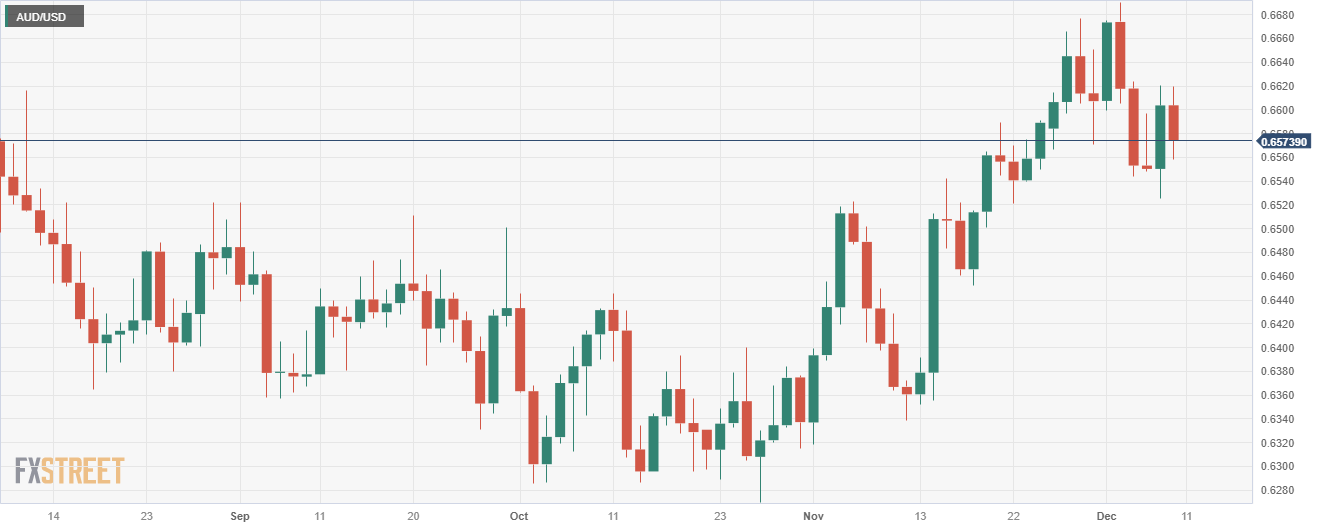
AUD/USD