-
AUD/USD licks its wounds after falling the most in a week.
-
A clear U-turn from the three-week old resistance line, the 50-SMA joins the bearish MACD signal to indicate further downside.
-
Ascending trend line from the last Friday restricts immediate downside of Aussie pair.
-
Previous support line from December, 100-SMA add to the upside filters.
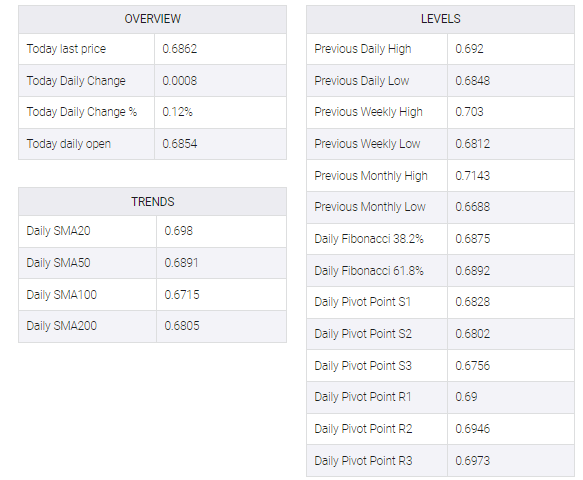
AUD/USD remains sidelined near 0.6860, printing mild gains by the press time of Wednesday’s Asian session, as bears take a breather following the biggest daily slump since the last Wednesday.
Even so, the Aussie pair keeps the previous week’s retreat from a downward-sloping resistance line from February 02, as well as the 50-SMA, amid a bearish MACD signal.
Also adding strength to the downside bias is the sustained trading below the support-turned-resistance line from late December 2022.
However, an upward-sloping support line from the last Friday, close to 0.6850 by the press time, restricts the immediate downside of the AUD/USD pair.
Following that, the 61.8% Fibonacci retracement level of the pair’s run-up from December 2022 to early February 2023, near 0.6830, will precede the monthly low of 0.6811 to challenge the AUD/USD bears before giving them control.
On the contrary, the aforementioned three-week-old descending resistance line, near 0.6900, as well as the 50-SMA level of around 0.6910, guard short-term AUD/USD recovery ahead of the multi-day-old previous support line, close to 0.6935 at the latest.
It should be noted that the 100-SMA level of 0.6950 acts as the last defense of the AUD/USD pair bears.
AUD/USD: Four-hour chart
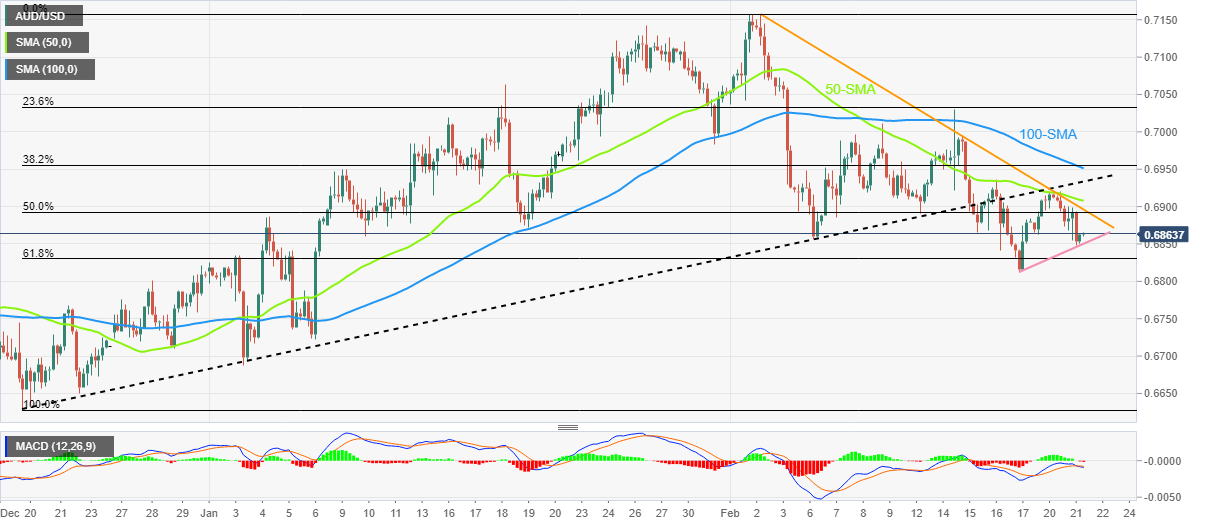
Trend: Further downside expected
ADDITIONAL IMPORTANT LEVELS