-
AUD/USD struggles for a direction as investors shift focus towards the US core PCE price index data.
-
Broader market mood is quite upbeat as rate cut expectations by the Fed deepen.
-
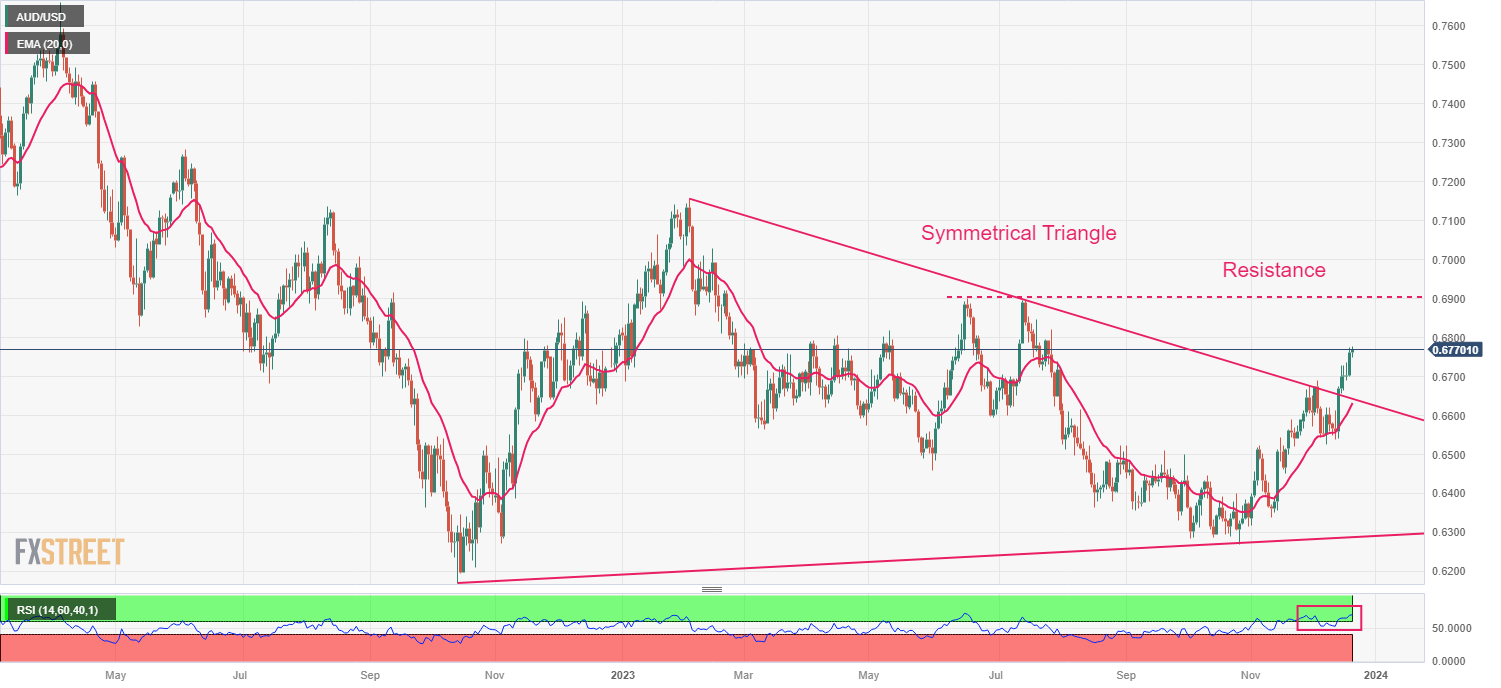
A breakout of the symmetrical triangle chart pattern has strengthened the Australian Dollar.
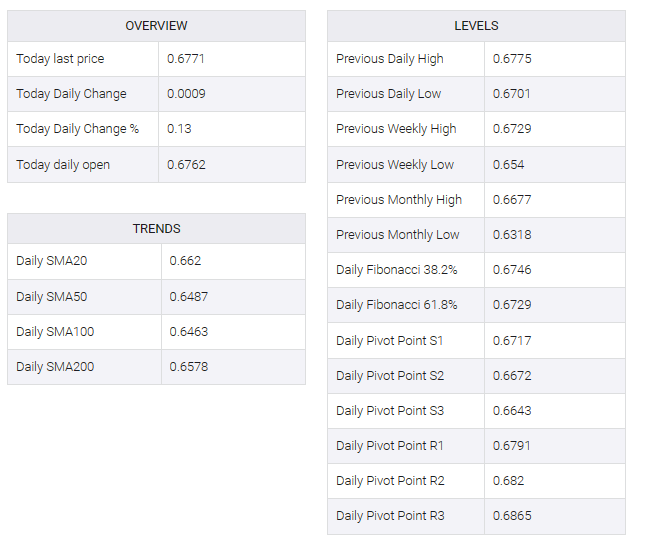
The AUD/USD pair traded within Tuesday’s trading range of 0.6700-0.6775 in the early New York session. Australian assets are struggling for direction as investors focus on key US personal consumption price index (PCE) data for November, due out on Friday.
The S&P500 opened on a negative note as profit-booking began The overall market mood is upbeat as investors lean towards deepening expectations of a rate cut by the Federal Reserve (Fed) in 2024. The US Dollar Index (DXY) faced selling pressure After a pullback move near 102.50.
On the Australian dollar front, the Reserve Bank of Australia (RBA) is expected to keep interest rates on hold as inflation in the Australian region is more than twice the required rate of 2%.
AUD/USD continued its winning streak after the breakout of the symmetrical triangle chart pattern formed on the daily scale. A breakout of the aforementioned chart pattern results in massive bullish ticks and heavy volume. The asset is expected to extend upside towards the immediate resistance of 0.6900.
The upward sloping 20-day exponential moving average (EMA) around 0.6630 Australian dollar continues to provide support to the bulls.
The Relative Strength Index (RSI) (14) has moved into the bullish range of 60.00-80.00, indicating that bullish momentum has been triggered.
Going forward, a decisive break above the intraday high of 0.6770 would expose the asset to the July 20 high at 0.6846, followed by the July 13 high near 0.6900.
On the flip side, downside bets would trigger if the asset breaks below December 7 low at 0.6525. Slippage below the same would drag the asset towards the psychological support of 0.6500 and November 17 low at 0.6452.


