-
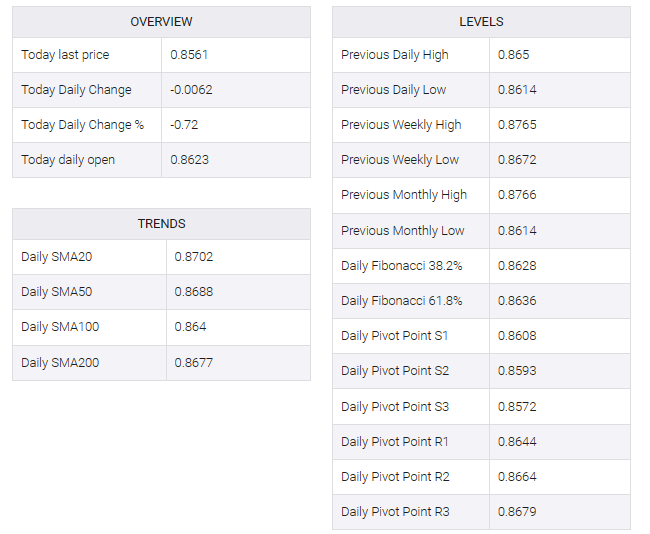
EUR/GBP was seen at 0.856 with a downside movement of 0.70%, it lowest since early September.
-
In the daily and 4-hour chart, indicators hit oversold conditions after a seven-day losing streak.
-
The cross will also close a 1.40% weekly loss.
In the Friday session, the EUR/GBP pair was seen at 0.8560 after a downward rally of 0.70%. On the daily and four-hour charts, the cross has reached oversold conditions indicating that an upward correction may be on the horizon, but the overall trend is currently in favor of sellers.
Technical indicators are displaying strong bearish momentum on the daily chart. The pair’s position below the 20, 100 and 200-day Simple Moving Averages (SMAs) underscores the dominant downtrend. Also, the rising red bars of the Moving Average Convergence Divergence (MACD) agree with this bearish outlook, reinforcing the impact of bearish pressure while the Relative Strength Index (RSI) navigates into oversold territory, a sign that is usually associated with selling involvement. Followed by an upward correction.
Examining the four-hour chart on the shorter time frame presents similar bearish signals. The pair is showing signs of oversold conditions as evidenced by the Relative Strength Index (RSI). When the Moving Average Convergence Divergence (MACD) prints rising red bars.
Support levels: 0.8530, 0.8515, 0.8500.
Resistance levels: 0.8600, 0.8630, 0.8670.
EUR/GBP daily chart

EUR/GBP