-
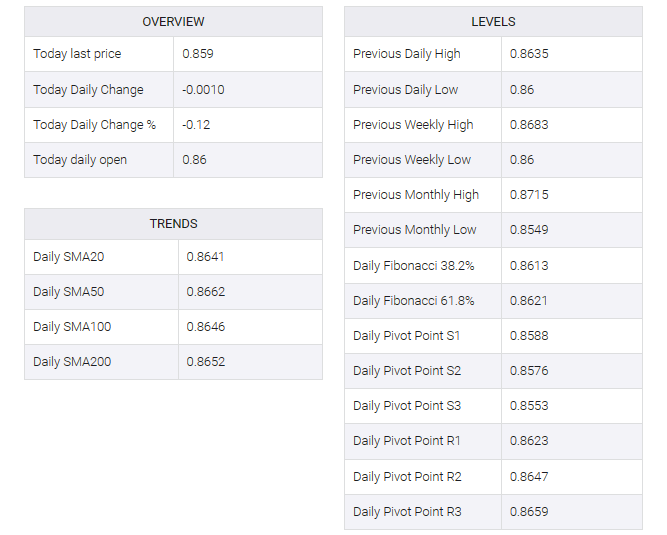
EUR/GBP hovers at 0.8590, experiencing a 0.17% loss as bears gain ground.
-
The bulls managed to push the cross to 0.8620 earlier in the session but failed to hold the momentum.
-
Indicators from the daily chart project bearish sentiment.
-
The four-hour chart reinforces bearish bias with RSI nearing oversold territory.
In Monday’s session, EUR/GBP traded at 0.8589, down 0.17%. The daily chart reveals a bearish outlook, with bears gradually gaining ground. This downbeat vibe is even more evident on the four-hour chart, where the indicators are deep in negative territory.
The negative slope and region of the Relative Strength Index (RSI) reflect that sellers dominate the current chart. This bearish trend is reinforced by the position of the cross, which is below the key simple moving averages (SMAs) – 20, 100, and 200-days, a clear indication that bears have a significant barrier for potential buyers to accept. Furthermore, the rising red bars of the Moving Average Convergence Divergence (MACD) indicate an ongoing bearish momentum, symbolizing a negative outlook for the bulls.
Zooming into the four-hour chart, bearish dominance is evident. The RSI approaches oversold levels, which often indicates an overwhelming amount of selling activity but is often followed by an upward correction. At the same time, the rising red bar of the four-hour moving average convergence divergence (MACD) reiterates the strength of selling momentum.


