-
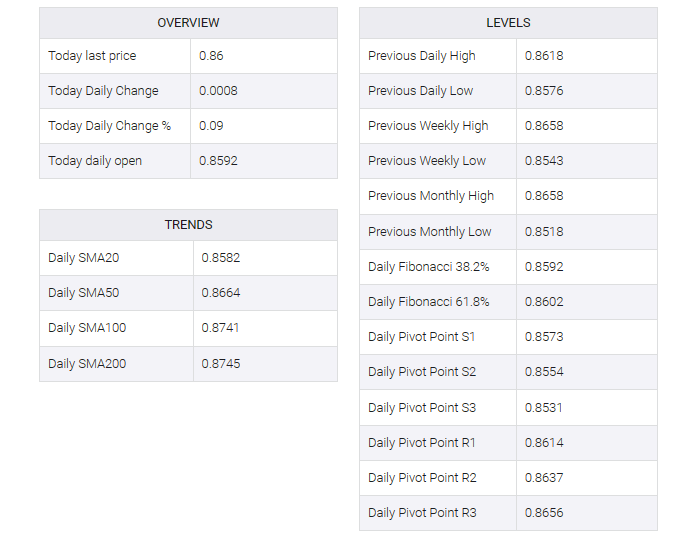
EUR/GBP rebounds after two consecutive losses but struggles to close above 0.86, indicating potential selling pressure.
-
Technical analysis shows the pair as neutral to downward biased, with EMAs acting as resistance levels.
-
Bearish scenario if EUR/GBP breaks below 0.8576 and targets June’s low of 0.8536, with further support at the YTD low of 0.8518.
EUR/GBP snapped two consecutive days of losses, gaining some 0.13% on Monday but failing to print a daily close above the 0.86 figure. Hence, EUR/GBP may face selling pressure. At the time of writing, EUR/GBP is trading at 0.8598 after a modest gain of 0.02%.
EUR/GBP Price Analysis: Technical outlook
The EUR/GBP daily chart depicts the pair as neutral to bearish bias. The upside is capped by the 50, 100, and 200-day exponential moving averages (EMA), each at 0.8643, 0.8689, and 0.8693, respectively. Conversely, the 20-day EMA at 0.8596 acts like a magnet, hovering around the EUR/GBP cross as the pair struggles to find direction.
Notably, EUR/GBP has continuously printed a series of high-high, high-low, but as long as the pair does not break above the 50-day EMA and the June 28 swing high of 0.8658, EUR/GBP may be under selling pressure and extended. loss of
A EUR/GBP bearish scenario could occur if the pair breaks below the June 30 daily low of 0.8576 and extends its losses past the June 23 low of 0.8536. Once cleared, the next support will be the year-to-date (YTD) low of 0.8518.
Conversely, EUR/GBP will turn bullish above 0.8658, with a combination of 100/200-day EMAs near 0.8689-93, ahead of the 0.8700 figure. A decisive break would reveal 0.8800.
EUR/GBP Price Action – Daily chart
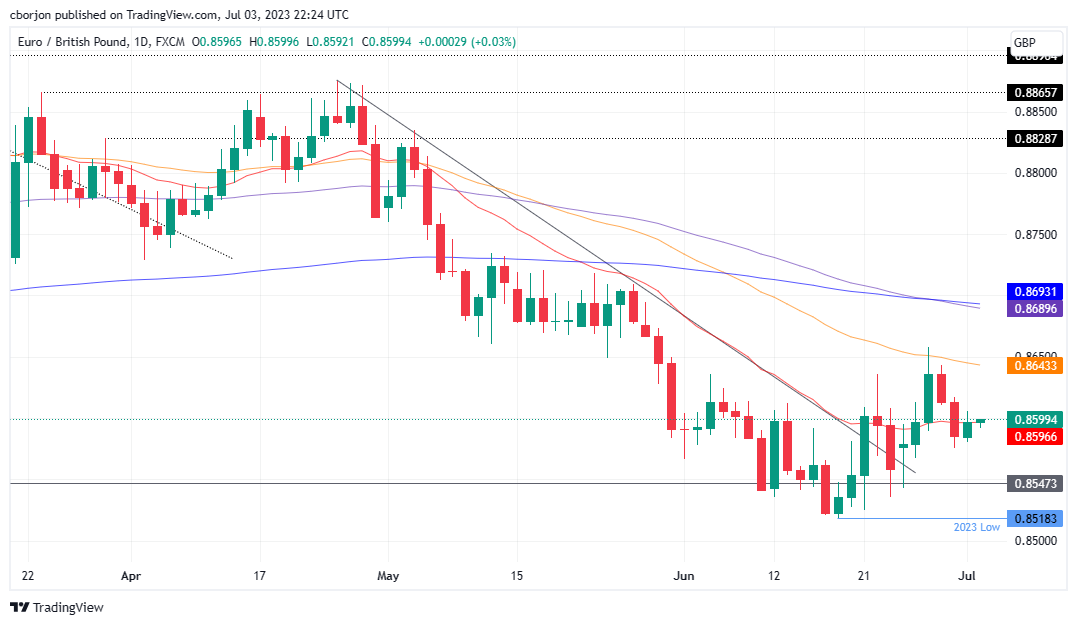
EUR/GBP