-
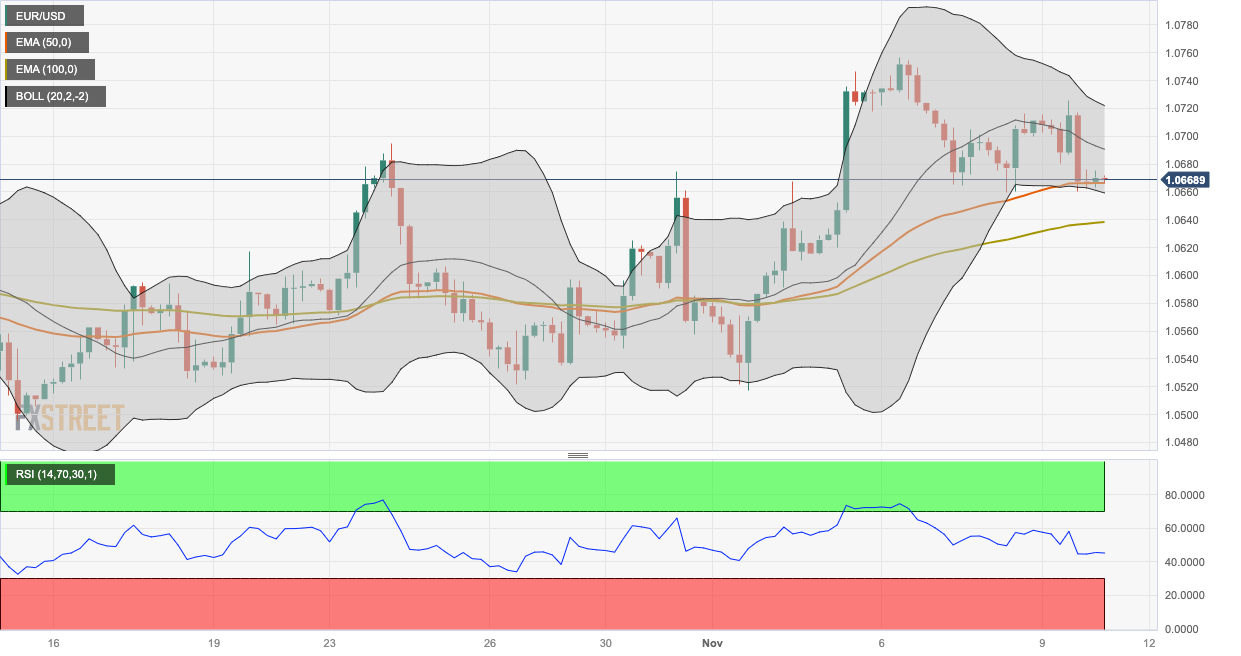
EUR/USD oscillates around the 1.0663-1.0675 region in a narrow trading band.
-
The pair holds above the key 100-hour Exponential Moving Averages (EMA), but the RSI indicator is located in bearish territory.
-
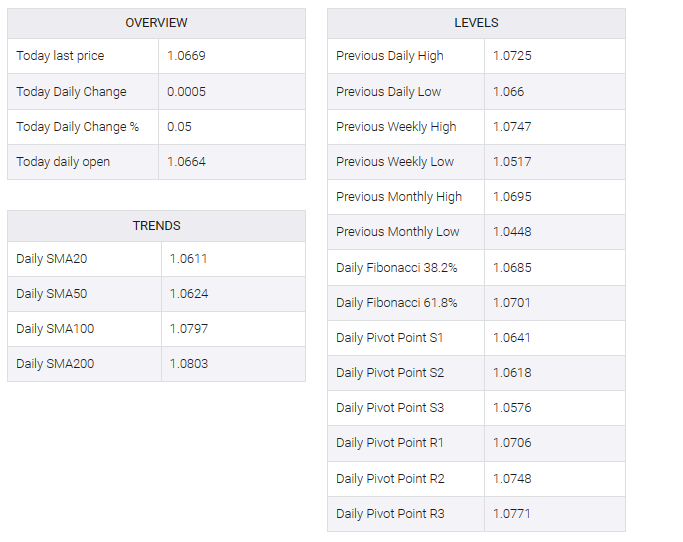
The first immediate resistance level will emerge at 1.0725; 1.0659 acts as an initial support level.
The EUR/USD pair consolidated its losses during the early European session on Friday. Dovish comments from Federal Reserve (Fed) Chairman Jerome Powell lifted the US dollar (USD) heavily and weighed on the pair. The major pair is currently trading near 1.0669, up 0.05% on the day.
Technically, the EUR/USD pair is above the 100-hour exponential moving average (EMA), indicating the path of least resistance to the upside. However, the Relative Strength Index (RSI) is in bearish territory below 50, indicating that sellers may retain control in the near term.
The first upside barrier for the major pair will appear at 1.0725, which will represent the confluence of the upper boundary of the Bollinger Bands and the November 9 high. Any decisive break above the latter would pave the way to the November 6 high of 1.0756. Further north, the next upside stop is located near the psychological round mark at 1.0800.
On the downside, the lower end of the Bollinger Bands at 1.0659 EUR/USD serves as an initial support level. The next resistance level is seen at 1.0638 (100-hour EMA). An additional downside filter to watch is 1.0600, which depicts a circular pattern and the October 27 high. A breach of the latter would see 1.0535 (October 27 low) drop to 1.0517 (November 1 low).


