-
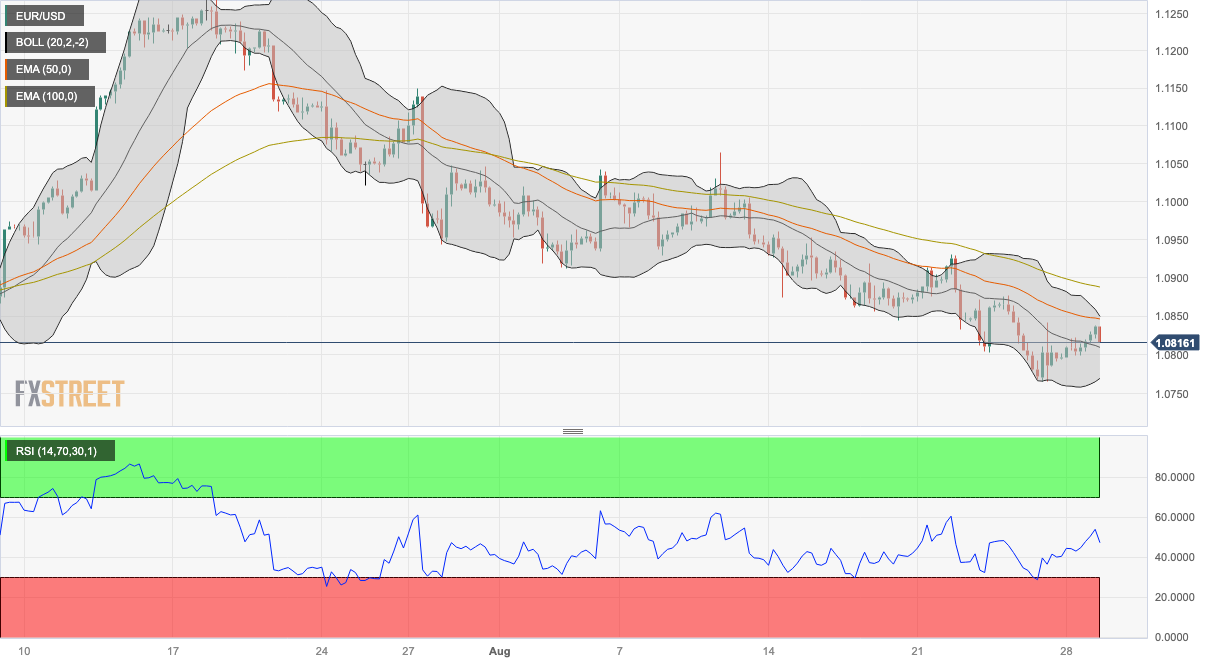
EUR/USD holds below the 50- and 100-day EMAs on a four-hour chart.
-
The Relative Strength Index (RSI) remains in bearish territory.
-
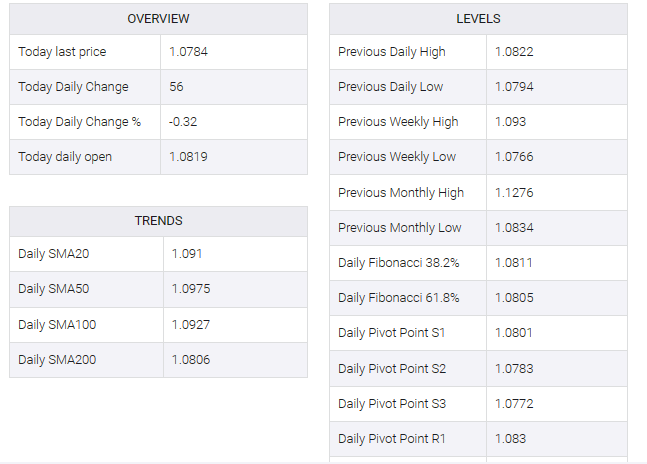
The first resistance level appears at 1.0845-1.0850 region; the key support level to watch is 1.0800.
The EUR/USD pair regained some lost ground but upside appears to be limited in Tuesday’s early European session. The major pair is currently trading near 1.0816, having lost 0.03% on the day. The prospect of additional interest rate hikes by the Federal Reserve (Fed) lifted US bond yields and limited USD losses.
According to the four-hour chart, the major pair is below the 50- and 100-day exponential moving averages (EMAs), suggesting the path of least resistance for EUR/USD is to the downside. Adding to this, the Relative Strength Index (RSI) remains below 50, supporting EUR/USD sellers for now.
The immediate resistance level for EUR/USD appears in the 1.0845-1.0850 region, which represents the confluence of the 50-hour EMA and the upper boundary of the Bollinger Bands. Further north, the pair will challenge the next hurdle at 1.0890 (100-hour EMA).
Any meaningful follow-through buying beyond the latter could pave the way for the next hurdle at 1.0930 (high of August 22) 1.1000 (a psychological round mark, high of August 8) and finally at 1.1065 (a high of August 22 August 10).
On the flip side, the key support level to watch is 1.0800, portraying a psychological round mark and a low of August 23. The additional downside stop is near the limit of the Bollinger Band and a low of August 25 at the 1.0765-1.0770 region. A decisive break below the latter would fuel a drop towards 1.0735 (a low of June 12) and 1.0675 (a low of June 6).
EUR/USD one-hour chart
EUR/USD