-
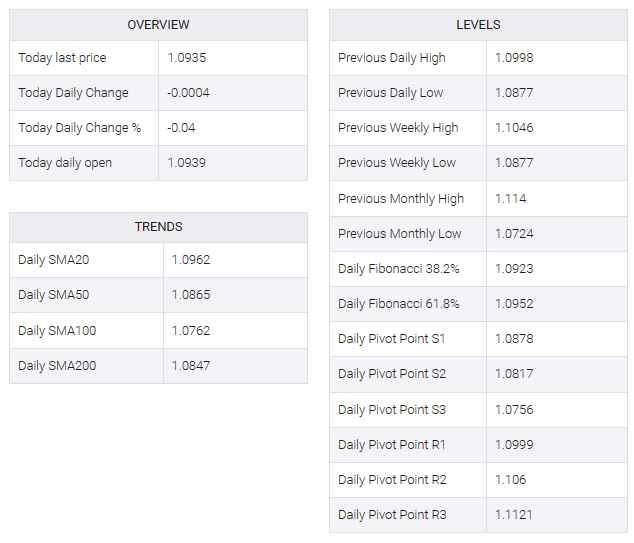
EUR/USD trades on a softer note amid the stronger USD.
-
The pair keeps the negative outlook unchanged below the key EMA; RSI indicator stands in bearish territory below the 50 midline.
-
The critical resistance level will emerge at 1.0970; the 1.0890–1.0900 zone acts as an initial support level.
The EUR/USD pair lost around 1.0935 in the early European session on Monday. The major pair’s downtick is supported by a stronger US dollar (USD) and higher US Treasury bond yields. US labor data on Friday cast doubt on expectations of a rate cut by the Federal Reserve (Fed). US Nonfarm Payrolls (NFP) rose to 216,000 in December from 173,000 in November, better than market expectations of 170,000.
According to the four-hour chart, EUR/USD’s bearish outlook remains intact as the major pair remains below the 50- and 100-hour exponential moving averages (EMA). Additionally, the 14-day Relative Strength Index (RSI) stands in bearish territory below the 50 midline, indicating that the path of least resistance is to the downside.
A key resistance level will emerge at 1.0970, which will depict the confluence of the 50-hour EMA, the upper boundary of the Bollinger Bands, and the January 4 high. The next upside barrier on the clock is close to a psychological goal mark and high on Jan 5 at 1.1000, followed by a high on Jan 2 at 1.1043 and a high on Dec 29 at 1.1080.
On the other hand, the 1.0890–1.0900 zone serves as the primary support level for EUR/USD. The mentioned level is the lower limit of the Bollinger Bands and the January 5 low. An additional downside filter to watch is the December 12 high at 1.0828. Further south, the next downside stop is near the December 13 low at 1.0773.


