-
GBP/USD pair attracts some buyers above 1.2200 on Friday.
-
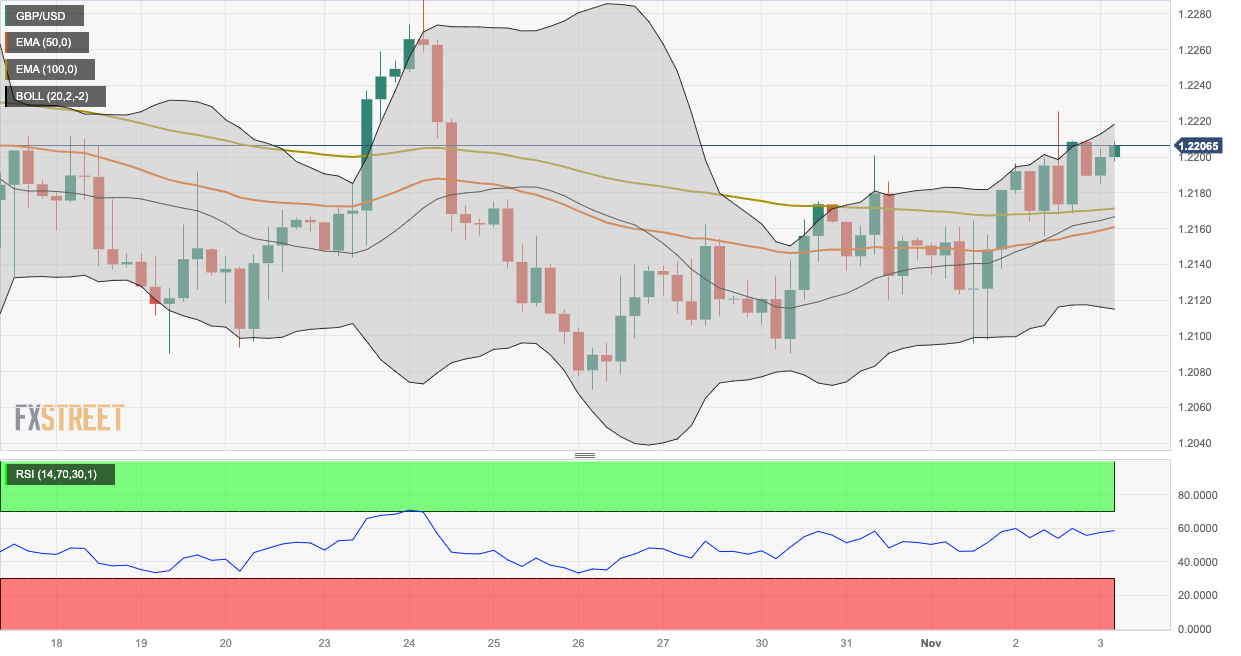
The pair holds above the 50- and 100-hour EMAs the the bullish RSI condition.
-
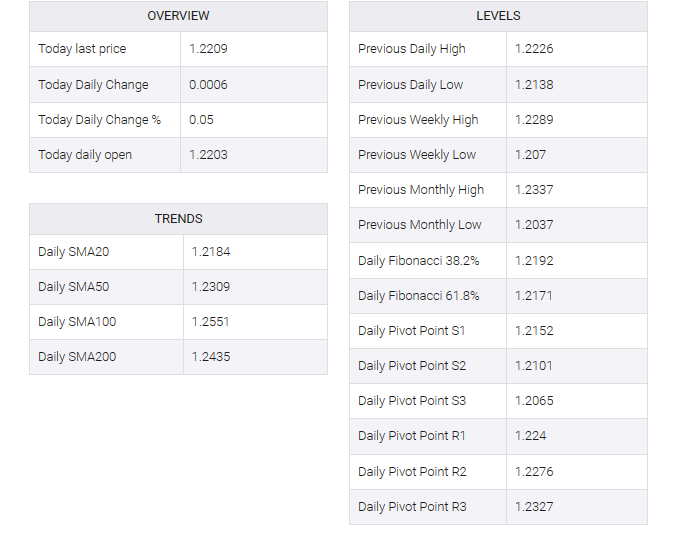
The first resistance level is located at 1.2217; 1.2170 acts as an initial support level.
The GBP/USD pair remained positive for the second day in a row in Friday’s early European session. As widely expected, the Bank of England (BoE) decided to keep interest rates unchanged at 5.25% on Thursday. During the press conference, BoE Governor Andrew Bailey said an additional rate hike may be appropriate, but Bailey ruled out a rate cut. The major pair is currently trading near 1.2208, up 0.08% on the day.
According to the four-hour chart, GBP/USD is above the 50- and 100-hour exponential moving averages (EMAs), which are supporting buyers for now. Furthermore, the Relative Strength Index (RSI) holds above 50 in bullish territory, indicating the path of least resistance to the upside.
That being said, the immediate resistance level for the major pair will emerge at the confluence of the upper boundary of the Bollinger Bands and the October 16 high at 1.2217. A decisive break above the latter would see a rally to 1.2288 (October 24 high). Further north, the next hurdle to watch is 1.2300 (circular figure), on the way to 1.2337 (October 11 high).
On the downside, the 100-hour EMA at 1.2170 acts as an initial support level. The additional downside filter will emerge near the lower limit of the Bollinger Band at 1.2115. The key contention level is located at the 1.2095–1.2100 area, portraying a psychological mark and a low of October 20. A breach of the level will see a drop to a low of October 26 at 1.2066.
GBP/USD four-hour chart
GBP/USD