-
GBP/USD defends corrective bounce off 11-week low, edges higher of late.
-
Convergence of previous support line, 61.8% Fibonacci retracement joins bearish MACD signal to prod Cable buyers.
-
Key DMAs, resistance line from mid-July also challenge Pound Sterling buyers.
-
Three-month-old horizontal support appears a tough nut to crack for bears.
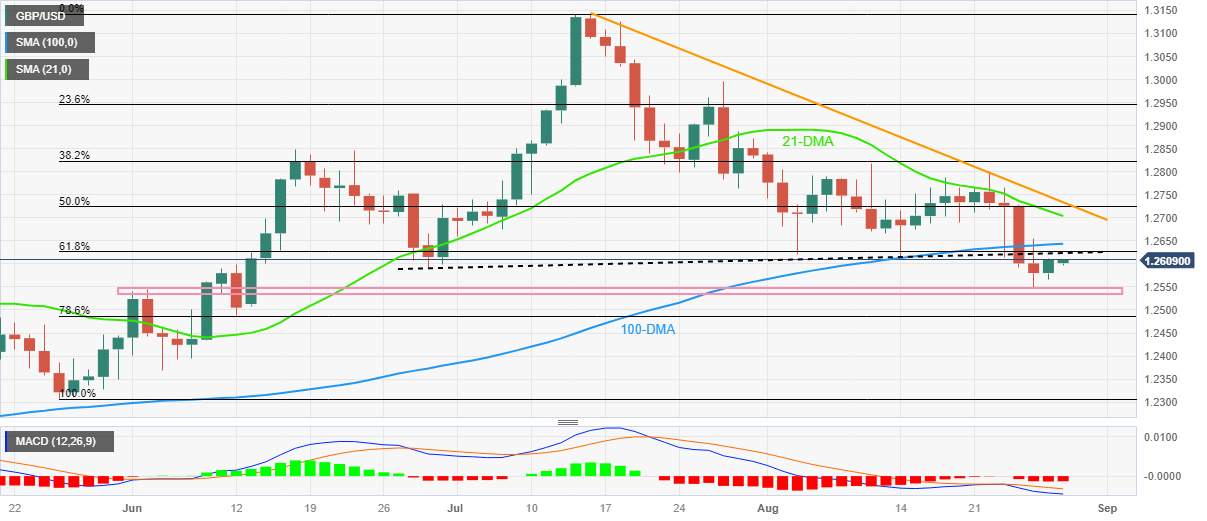
GBP/USD climbed above 1.2600 after a torrid start to the week, picking up bids near 1.2610 by early Tuesday in Asia. In doing so, the cable pair extended Friday’s late corrective bounce from the three-month-old horizontal support zone toward key technical supports earlier.
That said, a 61.8% Fibonacci retracement of the May-July highs and a meeting of the previous support line from late June, last around 1.2630, limits the immediate recovery of pound sterling buyers, especially in bearish MACD signals.
Even if the quote manages to cross the 1.2630 upside hurdle, the 100-DMA and 21-DMA around 1.2645 and 1.2705 respectively will challenge GBP/USD buyers.
In a case where the pair remains firmer after 1.2705, a downward-sloping resistance line from mid-July, around 1.2740 at press time, will be important for bulls to watch before taking control.
On the upside, the aforementioned horizontal support zone consisting of multiple levels identified since early June, around 1.2550–35, will be important to keep GBP/USD buyers optimistic.
Should the Pound Sterling remain bearish past 1.2535, the odds of witnessing a slump towards May’s monthly bottom of around 1.2300 can’t be ruled out.
Overall, GBP/USD remains on the bear’s radar event if the short-term recovery can’t be ruled out.
GBP/USD: Daily chart
Trend: Limited upside expected
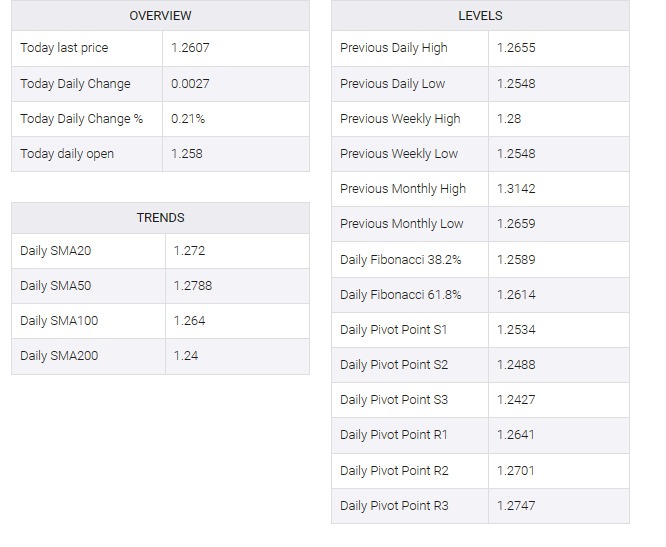
ADDITIONAL IMPORTANT LEVELS