-
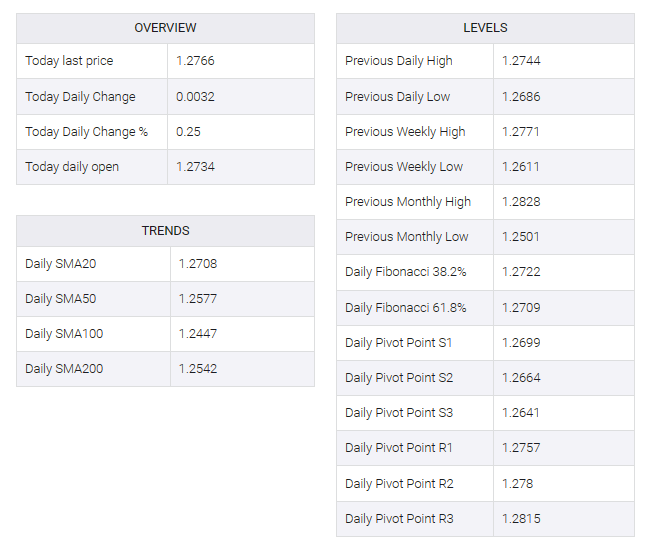
GBP/USD gains ground near 1.2765, up 0.25% on the day.
-
The bullish outlook of the pair remains intact above the key EMA; the RSI indicator stands in bullish territory above 50.
-
The key resistance level is seen at the 1.2800–1.2805 zone; 1.2715 acts as an initial support level for GBP/USD.
The GBP/USD pair held positive ground near 1.2765 in the early European session on Thursday. The pair’s upside is supported by a weaker US dollar (USD) and improved risk-on sentiment. Traders await the December US Consumer Price Index (CPI) for fresh stimulus. Core CPI is estimated to rise 3.8% YoY, while headline inflation will rise 3.2% compared to 3.1% previously.
On the four-hour chart, GBP/USD’s bullish outlook remains intact as the major pair remains above the 50- and 100-hour exponential moving averages (EMA). Furthermore, the Relative Strength Index (RSI) stands in bullish territory above 50, indicating that the minimum resistance level is on the upside.
A decisive break above the upper boundary of the Bollinger Band at 1.2778 would mark a psychological round and pave the way for the December 27 highs in the 1.2800-1.2805 region. Further north, the next resistance is seen at the December 28 high of 1.2828 and near the July 28 high of 1.2888.
On the flip side, the 50-hour EMA at 1.2715 acts as an initial support level for the pair. Any follow-through selling below the latter will expose the 100-hour EMA at 1.2696, followed by the lower limit of the Bollinger Band at 1.2680.


