-
GBP/USD recovers some lost ground near 1.2170 on the softer USD.
-
The pair holds below the 50- and 100-hour EMAs; RSI indicator stands in bearish territory.
-
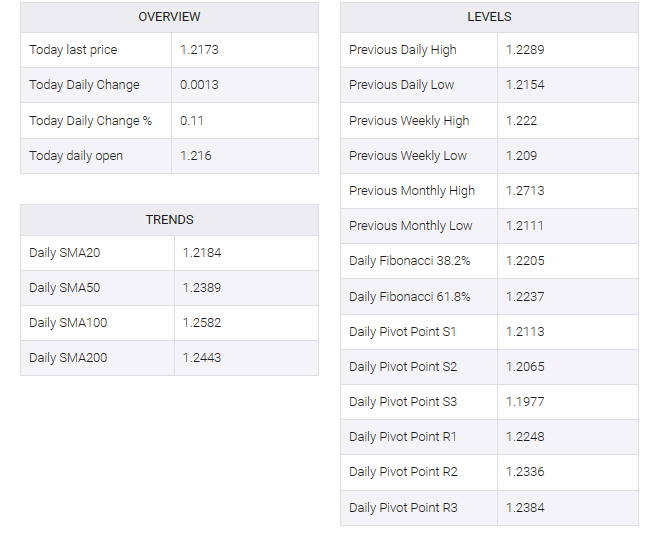
The key resistance level is located at 1.2200; 1.2143 acts as an initial support level.
The GBP/USD pair halted its decline during the Asian session on Wednesday and held below the 1.2200 mark. A fall in the US dollar (USD) and US Treasury bond yields gave the pair some support. However, renewed safe haven flows amid geopolitical conflicts in the Middle East and prolonged high rate narratives in the US may stall the USD’s downside for the time being. The pair is adding 0.08% on the day to trade at 1.2170 at press time.
Technically, GBP/USD is below the 50- and 100-hour exponential moving averages (EMAs) on the four-hour chart, which means the downside looks favorable. Additionally, the Relative Strength Index (RSI) is below 50 in bearish territory, supporting sellers for now.
That being said, the key resistance level is located at 1.2200, which depicts the confluence of the 50-hour EMA and a psychological round figure. Any decisive follow-through buying above the latter would pave the way to the October 16 high at 1.2218. Further north, the upper boundary of the Bollinger Band at 1.2271 will be the next stop. An additional upside filter to watch is near the October 10 high of 1.2295.
On the downside, a low of October 23 at 1.2143 acts as an initial support level. The next downside stop is seen at a low of October 13 at 1.2122. The critical contention level will emerge at the 1.2095–1.2100 region. The mentioned level is a round mark, the lower limit of the Bollinger Band, and a low of October 20. A breach of the level will see a drop to 1.2052 (low of October 3).
GBP/USD four-hour chart
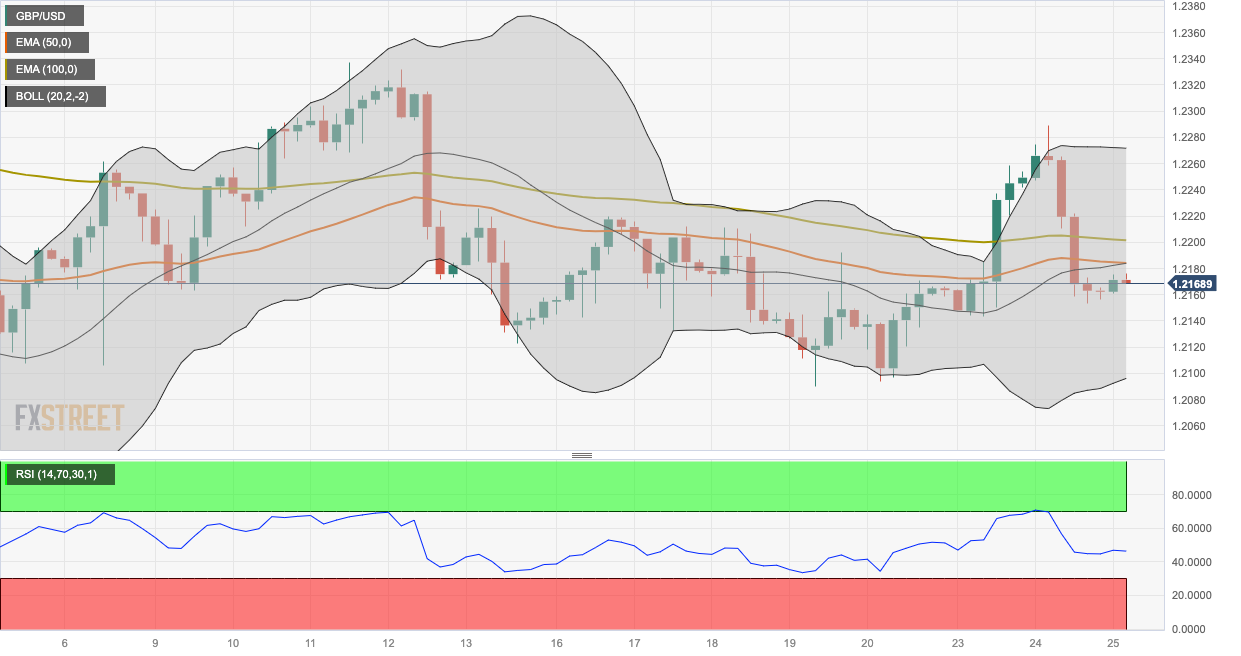
GBP/USD