
-
NZD/USD looks to extend losses due to the stronger US Dollar.
-
Technical indicators suggest a bearish sentiment in the pair.
-
Major level at 0.5800 aligned with the monthly low could act again as support.
NZD/USD struggles to remain in the positive territory after minor losses registered in the previous session due to weaker upbeat S&P Global PMI from the United States (US).
The US S&P Global Composite PMI showed an increase in October, rising to 51.0 from 50.2. The services PMI increased, reaching 50.9, while the manufacturing PMI rose to 50.0. The manufacturing index has maintained a level above the 50-point threshold for the past six months, indicating a positive shift in that sector.
NZD/USD traded near the 0.5850 psychological level during the European session on Wednesday. The pair almost pared its intraday gains as the US dollar (USD) extended gains for a second consecutive day.
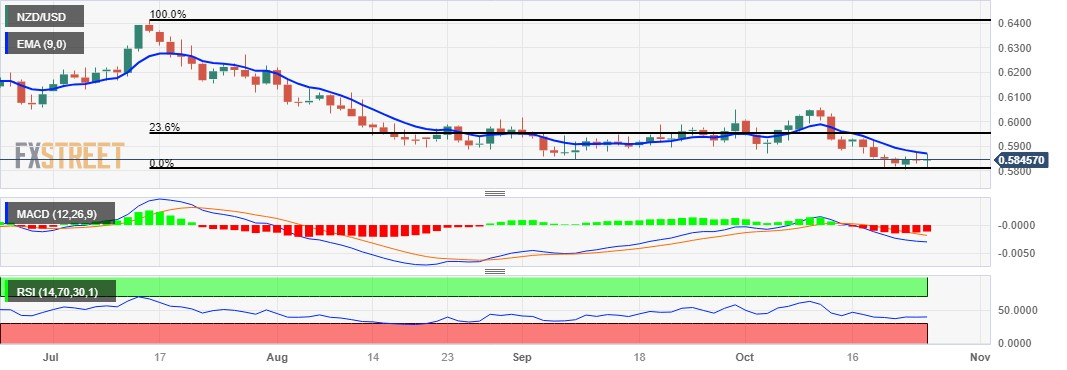
The nine-day exponential moving average (EMA) at 0.5870 is the key barrier, followed by the 0.5900 psychological level.
A solid break above the latter could open the door for the NZD/USD pair to explore the area around the 23.6% Fibonacci retracement at 0.5950.
On the downside, the area around the key level at 0.5800 could again act as immediate support for the NZD/USD pair, aligning with the monthly low at 0.5807.
The moving average convergence divergence (MACD) line lies below both the centerline and the signal line. The financial sonnet echoes a bearish break for the NZD/USD pair.
Moreover, the NZD/USD pair is revealing a bearish momentum, as the 14-day Relative Strength Index (RSI) shows a clear trend for weakness, flexing below the 50 level.
NZD/USD: Daily Chart
NZD/USD: ADDITIONAL LEVELS TO WATCH
