- NZD/USD could face challenges on risk-off market sentiment.
- A break above 0.6300 could support the pair to approach the weekly high at 0.6329.
- The lagging indicator MACD could give confirmation of the downward trend.
NZD/USD retraces its recent losses, trading higher around 0.6280 during the European session on Thursday. However, the NZD/USD pair faced challenges as the US Dollar improved on the market caution.
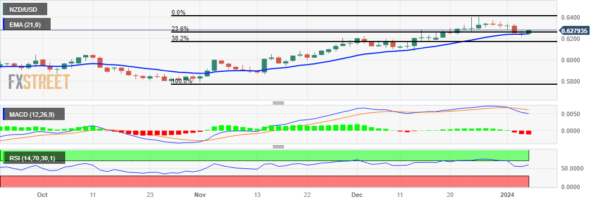
The 14-day Relative Strength Index (RSI) is above the 50 level, signaling a bullish sentiment. This suggests that the NZD/USD pair could potentially retest the 0.6300 major level. A breakthrough above the latter could influence the NZD/USD pair to surpass the weekly high at 0.6329 followed by the major resistance at 0.6350 level.
The placement of the Moving Average Convergence Divergence (MACD) line above the centerline, coupled with divergence below the signal line, suggests a potential shift toward a bearish sentiment in the NZD/USD pair. Traders may likely observe and await confirmation from this lagging indicator to validate the potential downward trend in the pair.
On the downside, the 23.6% Fibonacci retracement at 0.6260 appears as the immediate support followed by the major level at 0.6250 and the 21-day Exponential Moving Average (EMA) at 0.6244. A break below this support zone could influence the bears of the NZD/USD pair to test the psychological support at 0.6200 following the 38.2% Fibonacci retracement at 0.6167 level.
NZD/USD Daily Chart:


