-
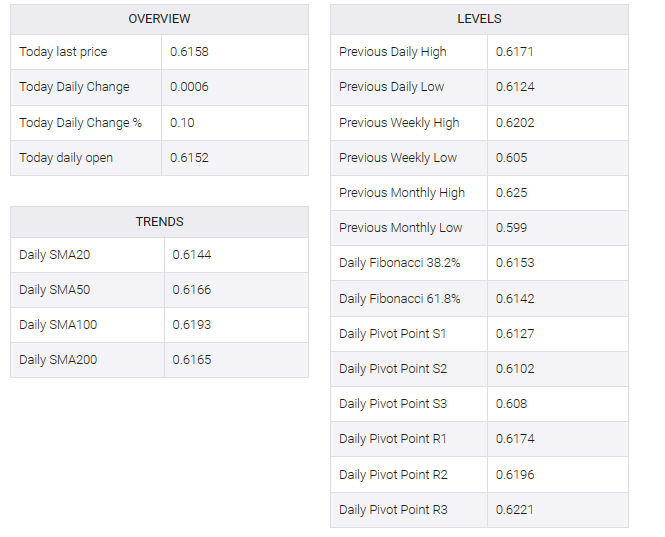
NZD/USD has sensed marginal selling pressure around a three-day high at 0.6160.
-
Investors are awaiting the release of the US ISM Manufacturing PMI data for further guidance.
-
NZD/USD is approaching the downward-sloping trendline plotted from June 15 high at 0.6250.
The NZD/USD pair faced some pressure after printing a new three-day high at 0.6160 in the early European session. Kiwi assets remain buoyant as Caixin Manufacturing PMI data outperformed expectations. The economic data came in higher at 50.5 than expected at 50.2 but was lower than the previous release of 50.9.
It is worth noting that New Zealand is one of China’s major trading partners and higher manufacturing activity in China supports the New Zealand dollar.
The US Dollar Index (DXY) is looking to move above 103.00 as investors await the release of US ISM Manufacturing PMI data for further guidance.
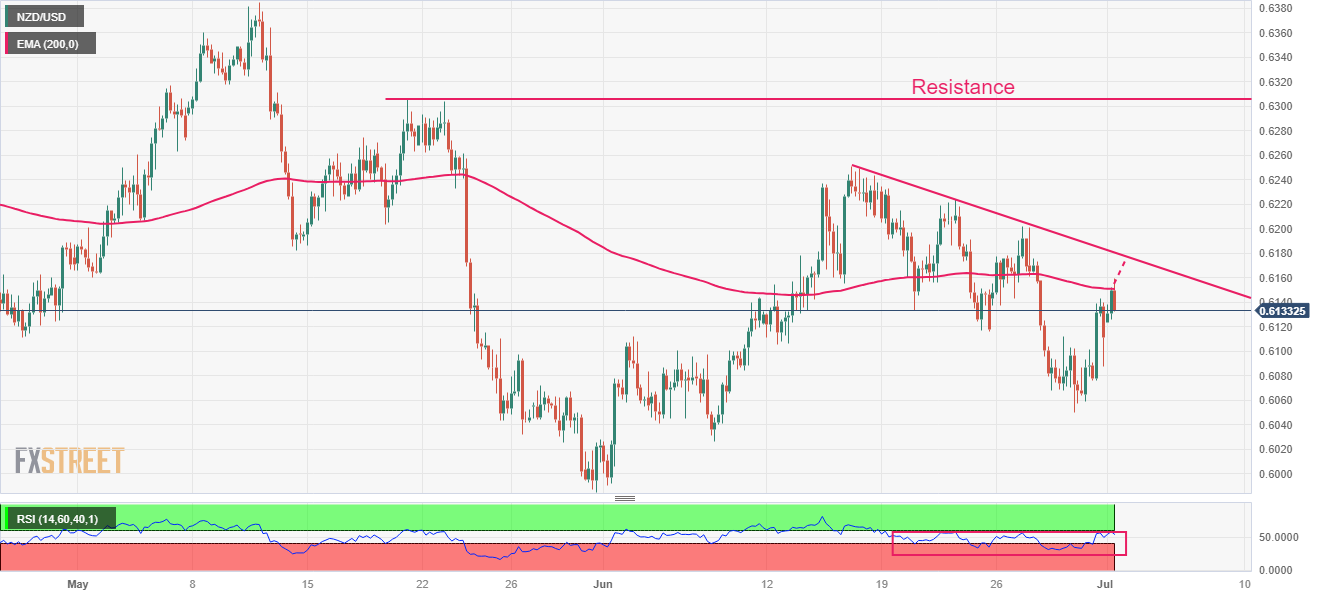
NZD/USD is approaching the down-sloping trendline plotted at the 0.6250 high from June 15 on the four-hour scale. Kiwi assets are facing resistance around the 200-period exponential moving average (EMA) at 0.6150, indicating that the long-term trend has yet to turn bullish. Horizontal resistance has been placed at the 0.6306 high since May 19.
The Relative Strength Index (RSI) is attempting to move into the bullish range of 60.00-80.00. The same event will strengthen New Zealand dollar bulls.
Going forward, a decisive break above the June 27 high of 0.6200 would lead to a June 14 high of 0.6236 and a May 17 high of 0.6274.
Alternatively, a downside move below 0.6116 on June 23 would reveal assets below June 05 at 0.6041. A slippage below the latter would expose the asset to psychological support at 0.6000.
NZD/USD four-hour chart
NZD/USD