-
USD/CAD attracts buyers for the second straight day and climbs back closer to the monthly peak.
-
A bullish USD acts as a tailwind, though rebounding Oil prices might underpin the Lonoie and cap.
-
The overbought RSI (14) might also hold back bulls from placing fresh bets ahead of Fed’s Powell.
The USD/CAD pair gains some follow-through positive traction for the second successive day on Friday and climbs back closer to its highest level since May 31 touched earlier this week. Bulls now await a sustained strength and acceptance above the 1.3600 mark before placing fresh bets, though the setup warrants some caution.
The US dollar (USD) rose to a two-and-a-half-month high during the Asian session, supported by growing acceptance that the Federal Reserve (Fed) will keep interest rates high for longer. This, in turn, is seen as the key factor pushing the USD/CAD pair higher. That said, a further recovery in crude oil prices, from a one-month trough set on Thursday, could underpin the commodity-linked loonie and act as a headwind for the major. Traders may also prefer to wait ahead of Fed Chair Jerome Powell’s highly-anticipated speech at the Jackson Hole Symposium.
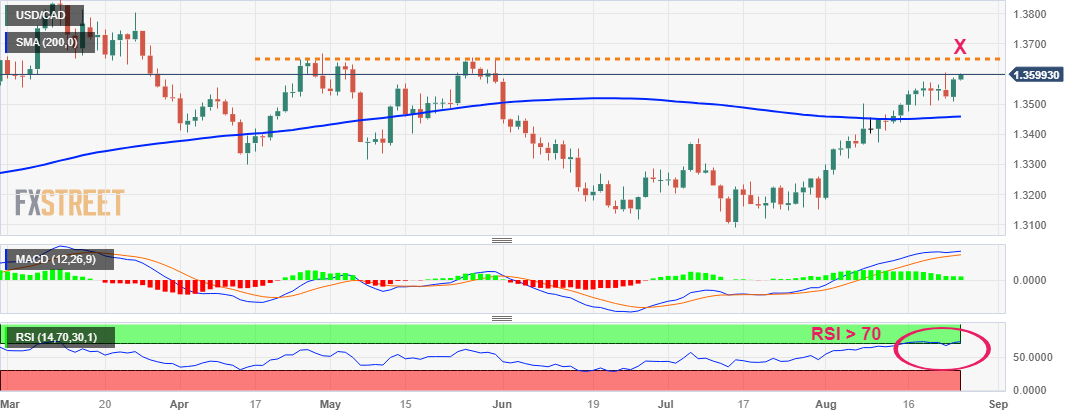
Even from a technical perspective, the Relative Strength Index (RSI) on the daily chart remains in overbought territory and makes it prudent to wait for some near-term consolidation or slight pullback before the next leg up. Hence, any further upside is likely to face stiff resistance near the 1.3650-1.3655 horizontal zone. Some follow-through buying, however, would be seen as a new trigger for the bulls and pave the way for an extension of the monthly uptrend. The USD/CAD pair may then aim to recover the 1.3700 mark and test the next relevant resistance near the 1.3735-1.3740 area.
On the flip side, any meaningful corrective pullback might now find decent support near the 1.3545 region, which if broken might expose the 1.3500 psychological mark. A further decline, meanwhile, is more likely to get bought into near a technically significant 200-day Simple Moving Average (SMA), currently around the 1.3455 zone. A convincing break below might shift the bias in favour of bearish traders and prompt aggressive technical selling. This will set the stage for deeper losses towards the 1.3400 round figure before spot prices eventually drop towards testing the 1.3370 support zone.
USD/CAD daily chart
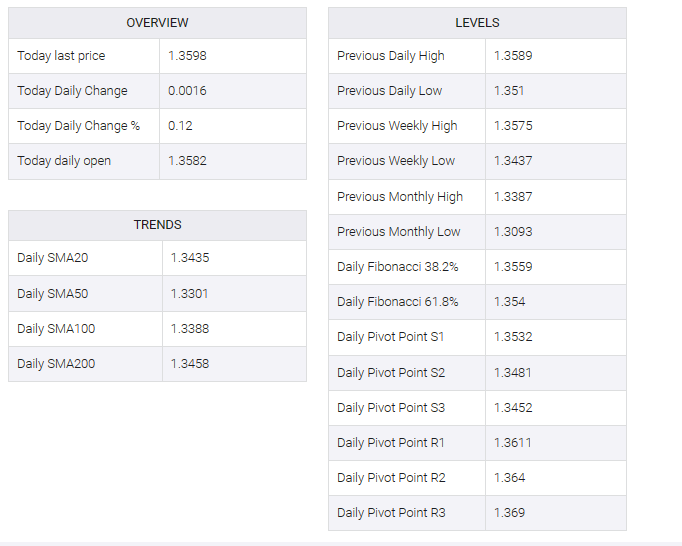
Technical levels to watch
USD/CAD