-
USD/CAD moves down in the negative territory as US Dollar fails to hold gains.
-
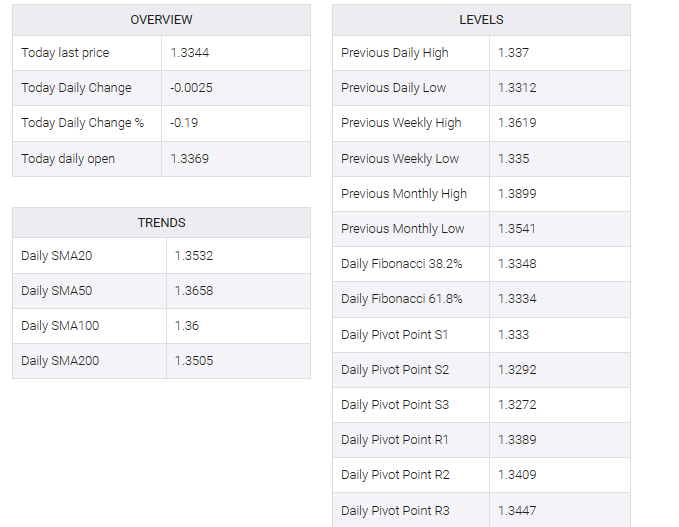
A break above 1.3350 could lead the pair to approach the seven-day EMA at 1.3398 aligned with the psychological level at 1.3400.
-
Technical indicators suggest the confirmation of further decline and testing the weekly low at 1.3311.
USD/CAD retraces its recent gains by trading below key resistance at the 1.3350 level. The USD/CAD pair faces pressure on the bearish USD dollar (USD) along with higher crude oil prices.
In conjunction with the psychological resistance level at 1.3400, the seven-day exponential moving average (EMA) at 1.3398 is likely to push the USD/CAD pair through significant levels.
A further break above this psychological resistance could see the pair explore the vicinity of the key level at 1.3450, followed by the 23.6% Fibonacci retracement level at 1.3452.
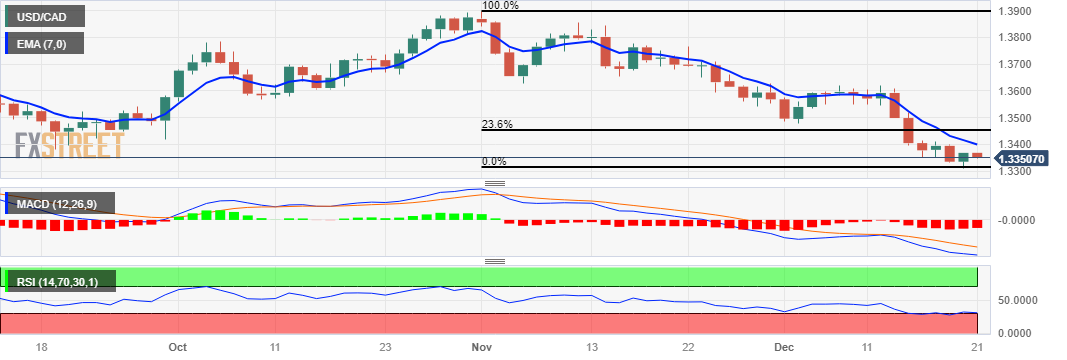
On the other hand, the Moving Average Convergence Divergence (MACD) technical indicator for the USD/CAD pair indicates a possible bearish trend. The MACD line is positioned below the center line and deviates below the signal line, indicating a possible further decline.
The analysis adds weight to the prevailing dovish sentiment surrounding the USD/CAD pair, emphasizing the importance of the 14-day Relative Strength Index (RSI) dipping below 50. This confirmation suggests that the pair could revisit the weekly low around the 1.3311 level. A break below the weekly low holds the potential to push the USD/CAD pair towards the psychological level at 1.3300.
USD/CAD: Daily Chart
USD/CAD: MORE TECHNICAL LEVELS TO WATCH