-
USD/CHF holds lower grounds inside two-month-old bullish chart pattern.
-
Downbeat MACD, RSI (14) suggest break of wedge towards the south.
-
Four-month-long descending support line lures Swiss Franc bears; buyers need validation from 100-DMA
USD/CHF remains under pressure near the intraday low of 0.9020 heading into Wednesday’s European session. In doing so, the Swiss Franc (CHF) pair sellers approached the bottom line of the two-month-old falling wedge bullish chart pattern.
It is worth noting that the absence of a bearish MACD signal and an oversold RSI (14) keeps USD/CHF pair sellers hopeful of breaking the immediate support, i.e. the lower line of the mentioned wedge, near 0.8990 at press time.
In the event that USD/CHF breaks below 0.8990, the June 2021 low near 0.8925 holds the key to the downside for the quote. A break that raises the possibility of witnessing another decline towards a downward-sloping support line from early November 2022, lastly near 0.8745.
Alternatively, an upside clearance of the top line of the mentioned wedge near 0.9100, confirms the bullish chart formation which indicates a theoretical target of around 0.9530.
During the run-up, USD/CHF bulls need validation from the 100-DMA barrier near 0.9265.
Also acting as an upside filter is the previous monthly high of 0.9438.
Overall, USD/CHF remains on the bears’ radar while targeting new 2023 lows. However, the downside room seems limited unless the quote breaks the 0.8925 mark.
USD/CHF: Daily chart
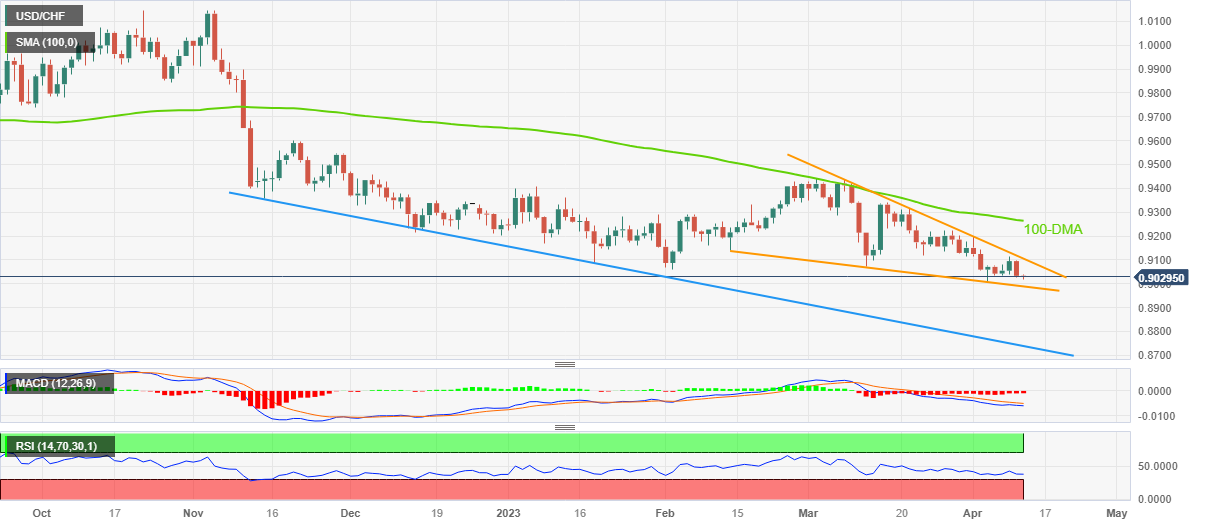
Trend: Further downside expected
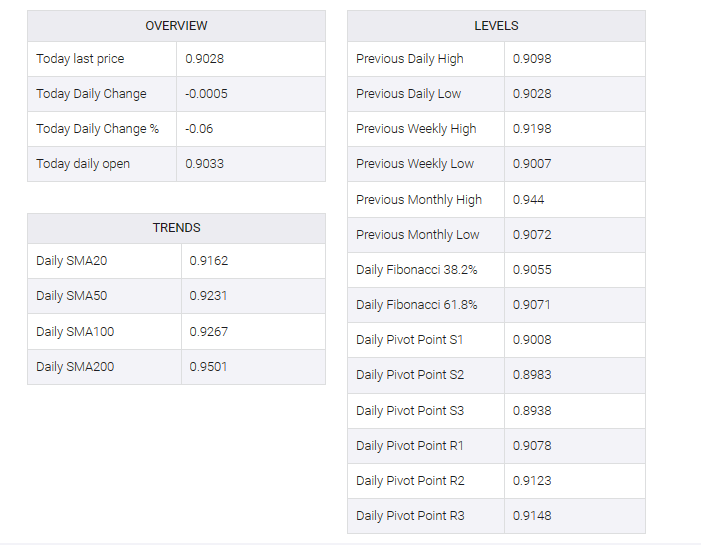
ADDITIONAL IMPORTANT LEVELS