
-
USD/CHF bulls eye 0.9350 near a 78.6% Fibonacci.
-
Bears seek a move lower after the breaks of structure.
USD/CHF fell on Monday and entered the daily bullish trendline which revealed the figure of 0.93. The following already illustrates the risks of a bullish correction but an overall tilt with a bearish bias due to a break in market structure.
USD/CHF daily chart
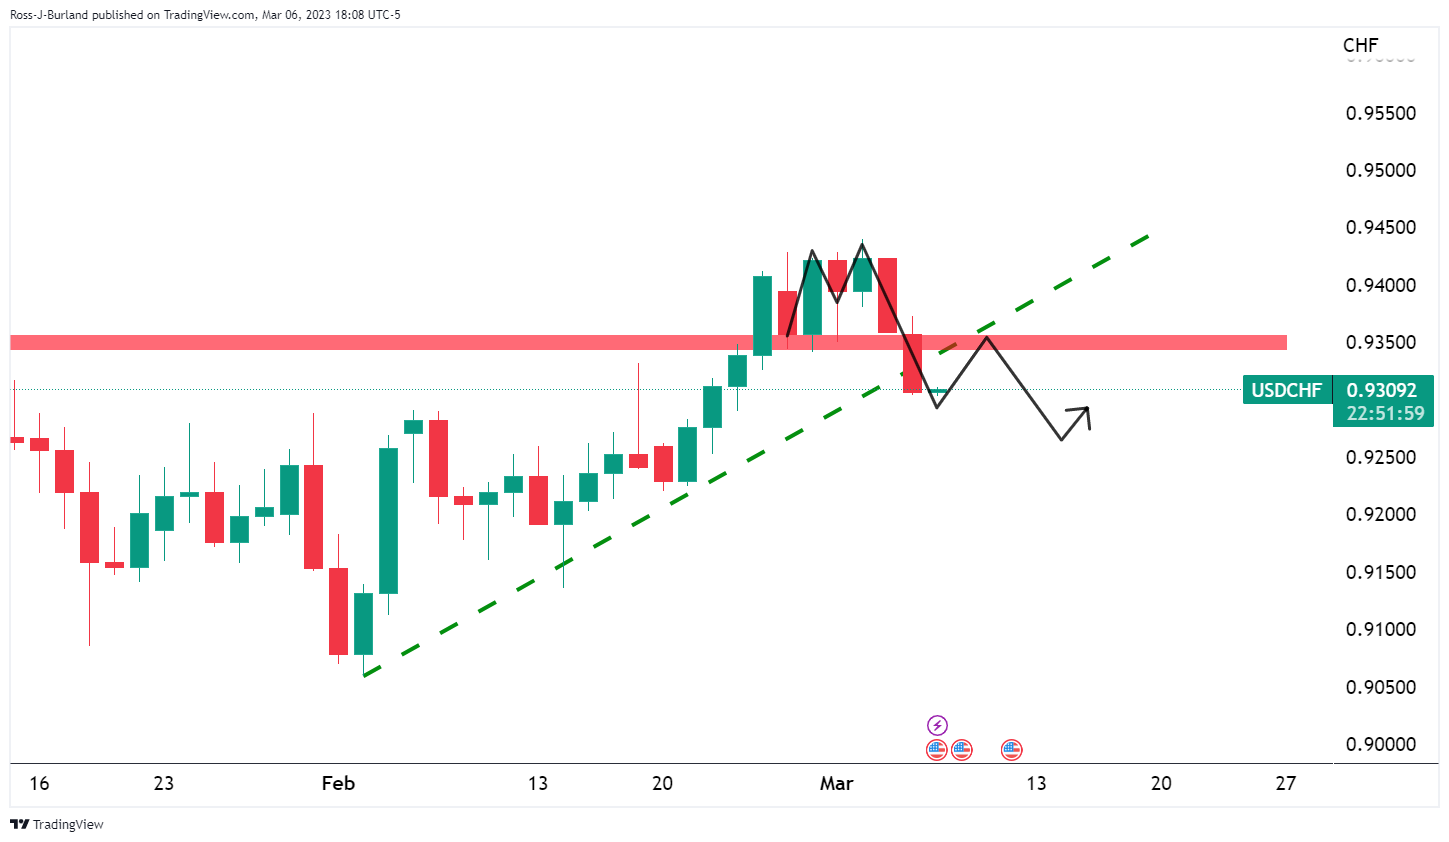
The M-formation is a reversion pattern and the price would be expected to retrace to restest the prior support near 0.9350.
USD/CHF H4 charts
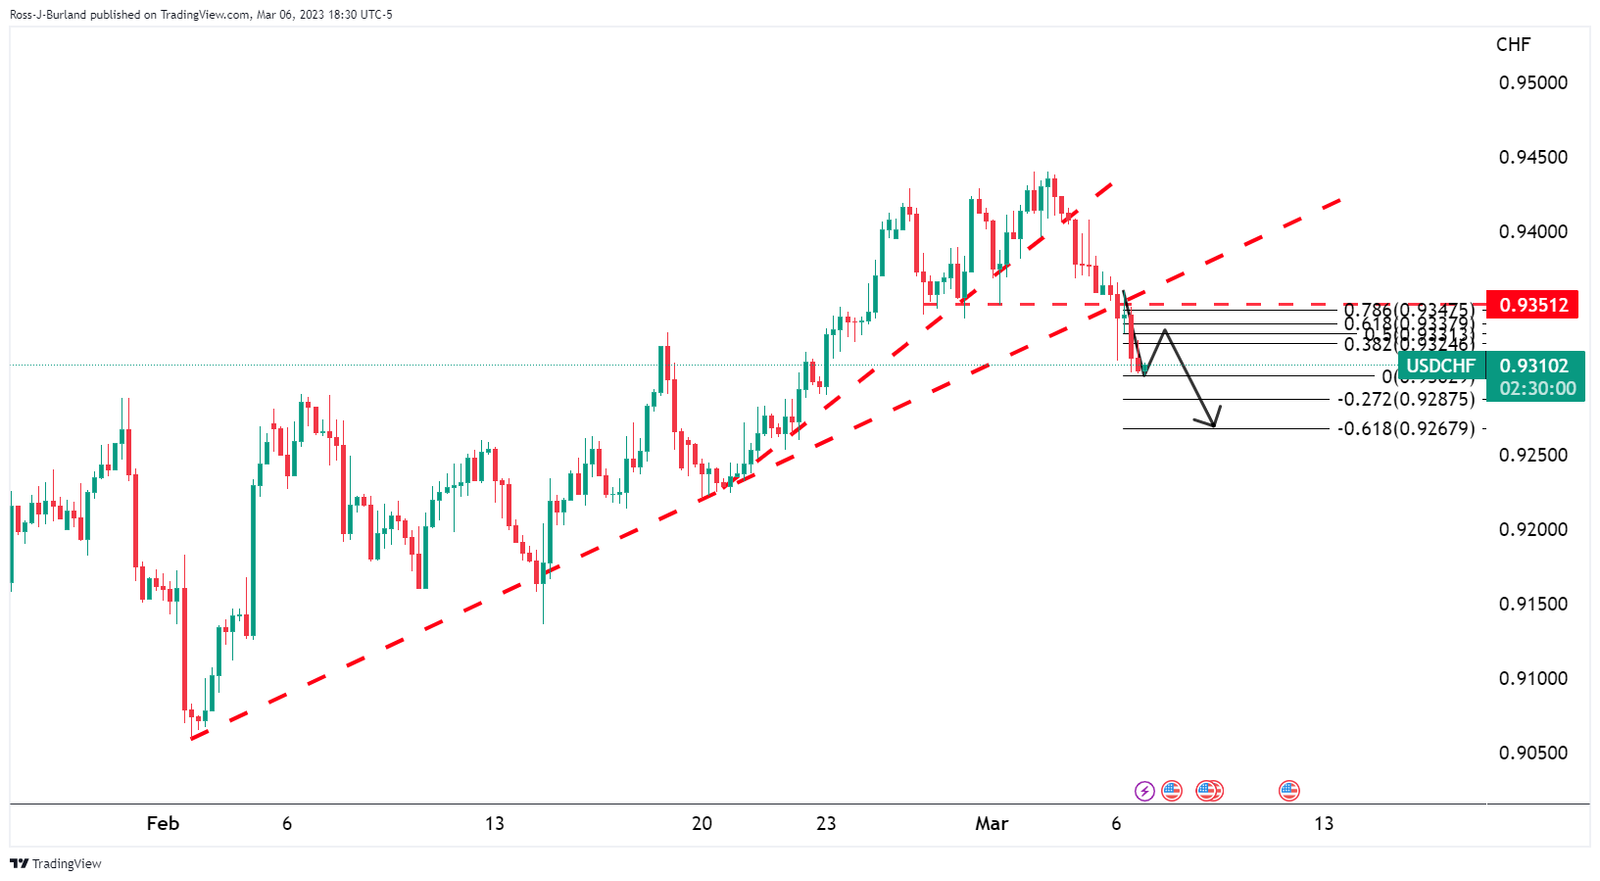
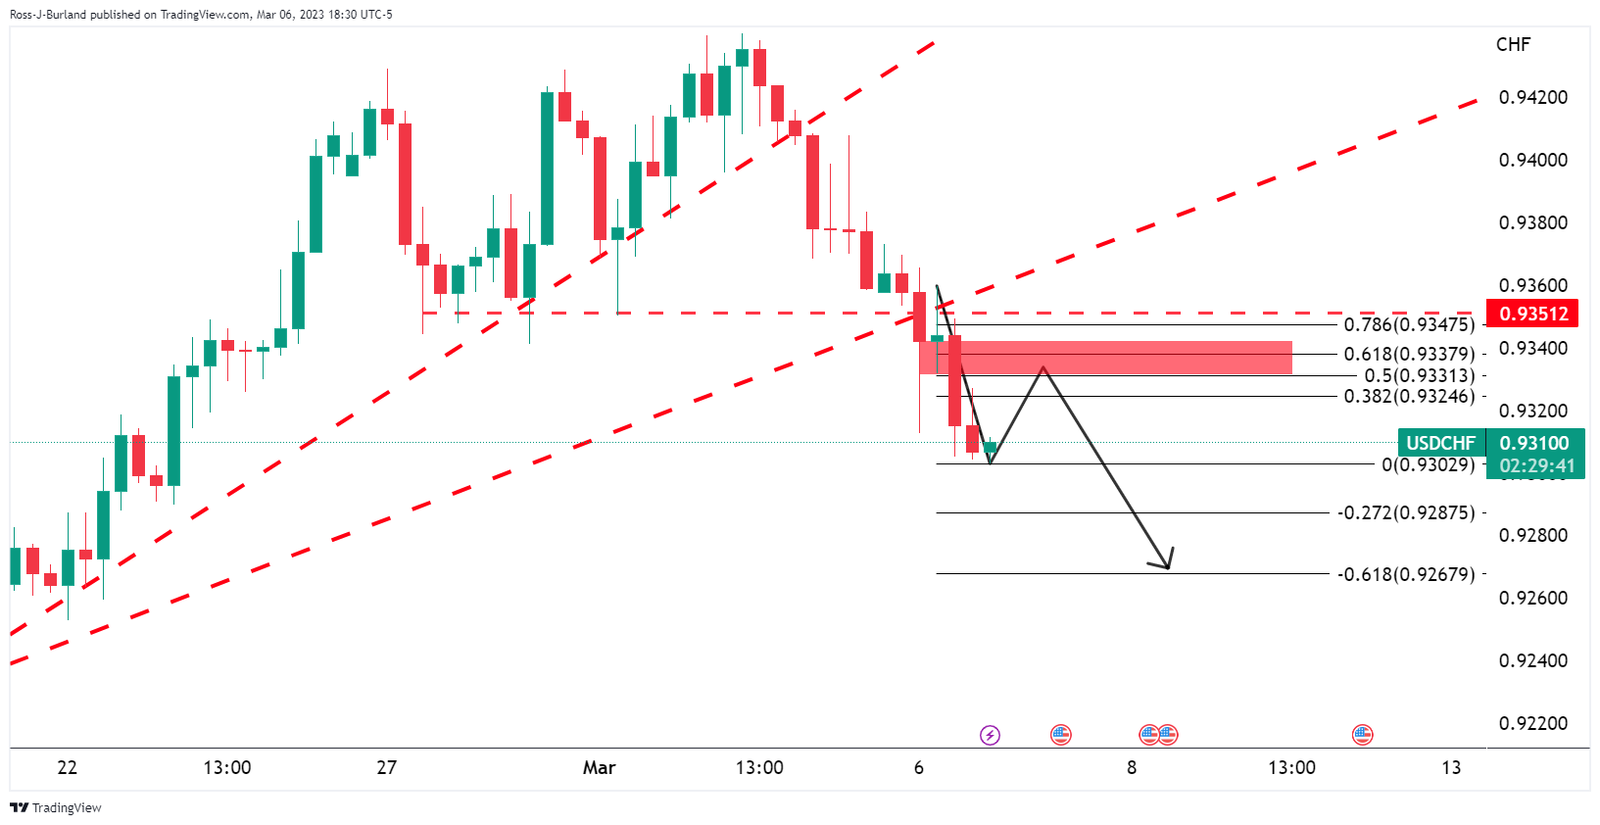
Zooming in, we can see that 0.9350 could be a touch higher than where the bulls might be able to get to. We have the 78.6% Fibonacci just below it and prior support that could be resistance near the 61.8%.