-
Widespread US dollar weakness across the board is a headwind for USD/CHF.
-
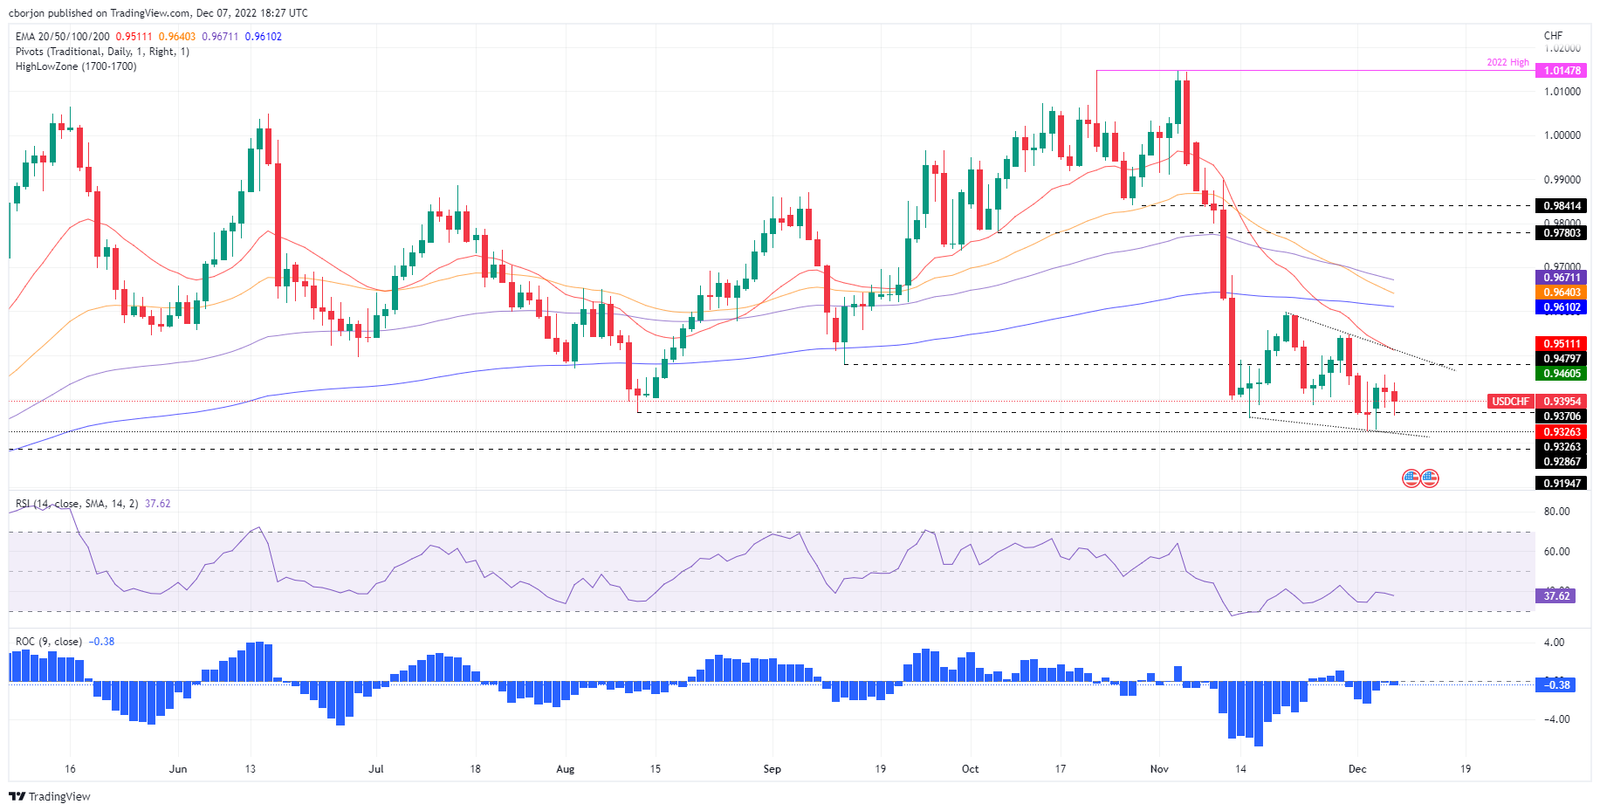
A falling wedge in the USD/CHF daily chart suggests the pair might break upwards
-
USD/CHF: A break below 0.9326 could pave the way to 0.9300; Otherwise, a rally to 0.9400 is on the cards.
The USD/CHF extends its losses for two consecutive trading sessions, down by a minuscule 0.22%, after hitting a daily high of 0.9437. At the time of writing, the USD/CHF is trading at 0.9396, as the US Dollar Index (DXY) plunges 0.51%.
USD/CHF Price Analysis: Technical outlook
From a daily chart perspective, the USD/CHF daily chart suggests that the pair is biased to the downside. Since mid-November, USD/CHF has formed a falling wedge, a bullish continuation chart pattern, which appeared after a wide swing from the near 2022 high of 1.0147 to last week’s low of 0.9326. Hence, USD/CHF may consolidate within the wedge boundary before breaking to the upside/downside.
Oscillators give mixed signals, with the Relative Strength Index (RSI) aiming downwards, while the Rate of Change (RoC) portrays selling pressure fading. Unless the USD/CHF breaks below 0.9326 and poses a challenge to break the wedge on the downside, that could lay the ground for a test of the 0.9300 figure.
As an alternate scenario, the USD/CHF first resistance would be the 0.9400 figure, followed by the September 13 daily low-turned-resistance at 0.9479, followed by the wedge’s top-trendline at 0.9505, and the 20-day Exponential Moving Average (EMA) At 0.9510.
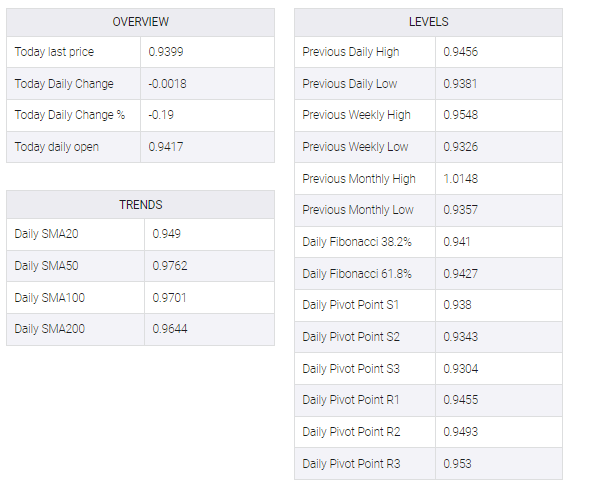
USD/CHF Key Technical Levels
USD/CHF