-
USD/CHF fades week-start recovery near short-term key resistance line, stays sidelined of late.
-
Bearish candlestick formation, sluggish RSI also signal pullback moves.
-
Convergence of 50-SMA, one-week-old ascending trend line restrict short-term downside.
-
Bulls have a bumpy road to ride unless crossing 200-SMA.
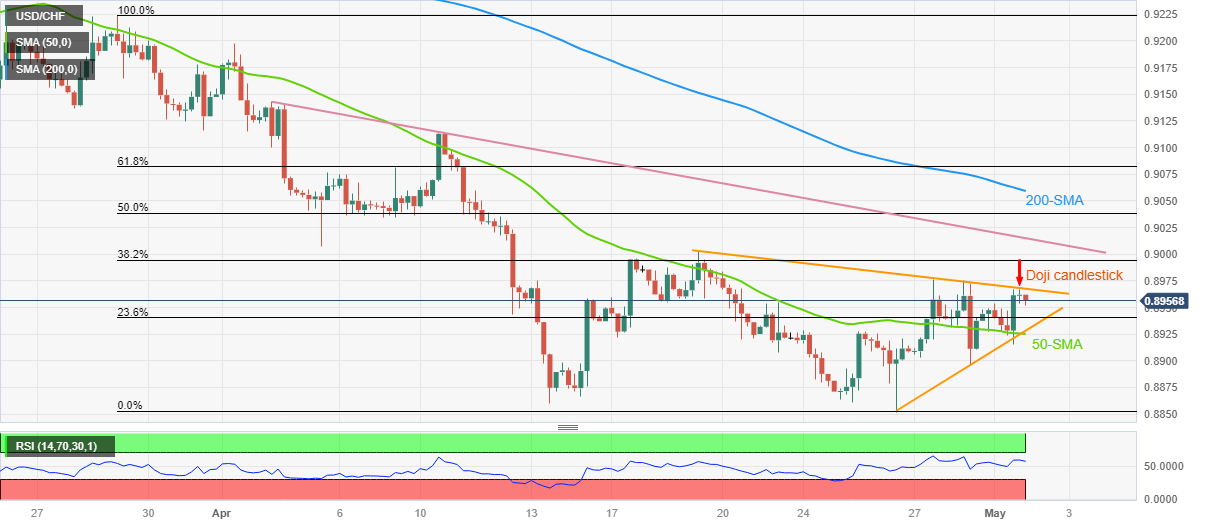
USD/CHF looked close to 0.8950-60 after failing to break above the two-week-old resistance line early on Tuesday. In doing so, the Swiss Franc (CHF) pair justified the previous day’s doji candlestick while sustaining mild losses near the aforementioned price after an upward start to the week.
With this, the USD/CHF price is likely to decline towards the 0.8925-20 support confluence comprising the 50-SMA and the one-week-old upside support line.
In a case where the USD/CHF bear holds the reins above 0.8920, the 0.8900 round figure and the previous monthly low, as well as the annual low near 0.8850, will be in the spotlight.
It is worth noting that the pair’s weakness before 0.8850 would make it vulnerable to a drop towards the 2021 low of 0.8755.
On the flip side, the aforementioned resistance line, near 0.8965 by the press time, precedes the late April swing high of around 0.8975 to restrict the immediate USD/CHF upside.
Following that, a one-month-old downward-sloping resistance line and the 200-SMA, respectively near 0.9015 and 0.9060, will be in the spotlight.
Overall, USD/CHF remains depressed but the bears are likely running out of steam, which in turn highlights the 0.8925-20 support confluence.
USD/CHF: Four-hour chart
Trend: Further downside expected
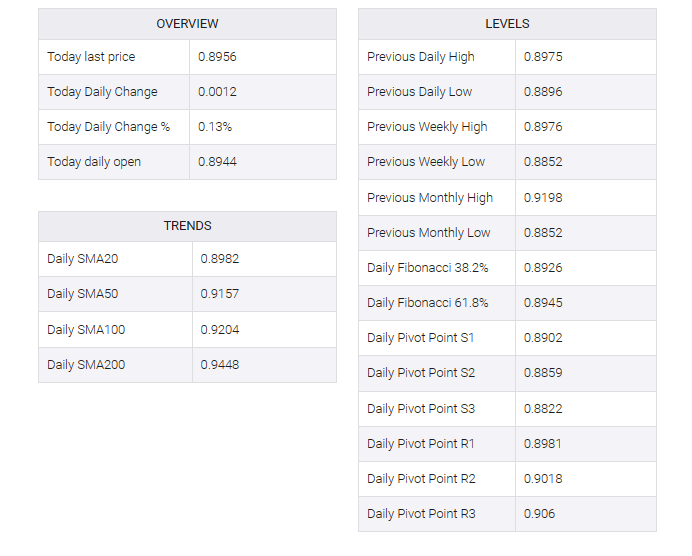
ADDITIONAL IMPORTANT LEVELS