-
USD/CHF has lost more than 100 pips in the previous session.
-
MACD indicates a slower pace of the prevailing bearish trend.
-
The major level at 0.8900 appears as the immediate resistance lined up with the 23.6% Fibonacci retracement.
USD/CHF lost more than 100 pips in the previous session, due to the downbeat US inflation data. The USD/CHF pair extends the losses, trading near 0.8870 during the European session on Wednesday.
A decisive break below the latter could push the USD/CHF pair to reach the support region near 0.8800 psychological level lined up with September’s low at 0.8795.
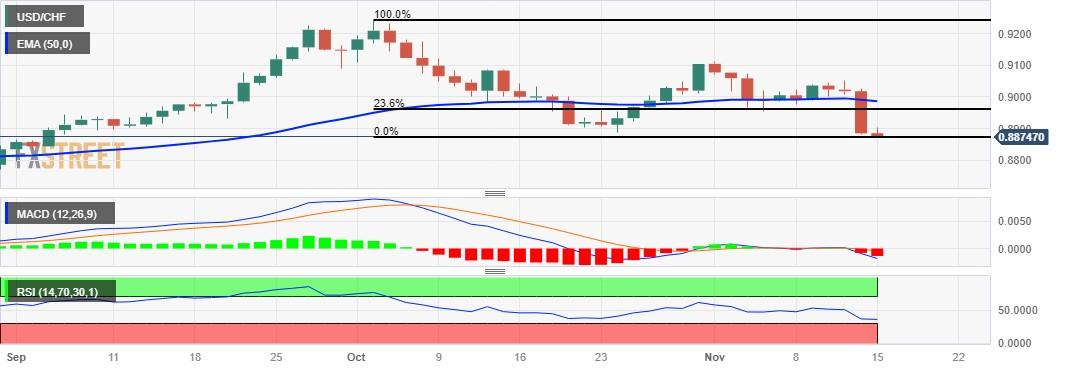
Technical indicators of the USD/CHF pair reveal a bearish outlook. A 14-day relative strength index (RSI) below the 50 level indicates bearish pressure, signaling a bearish momentum and reflecting a weak market sentiment.
On the upside, the psychological level at 0.8900 appears as immediate resistance, followed by the 23.6% Fibonacci retracement at 0.8922. A solid break above the level could motivate the USD/CHF pair to explore the next resistance near the 50-day exponential moving average (EMA) at 0.8986.
Furthermore, the Moving Average Convergence Divergence (MACD) line, although below the centerline, is above the signal line. This suggests a slightly lighter move in the USD/CHF pair, indicating a less pronounced bearish sentiment.
USD/CHF: Daily Chart
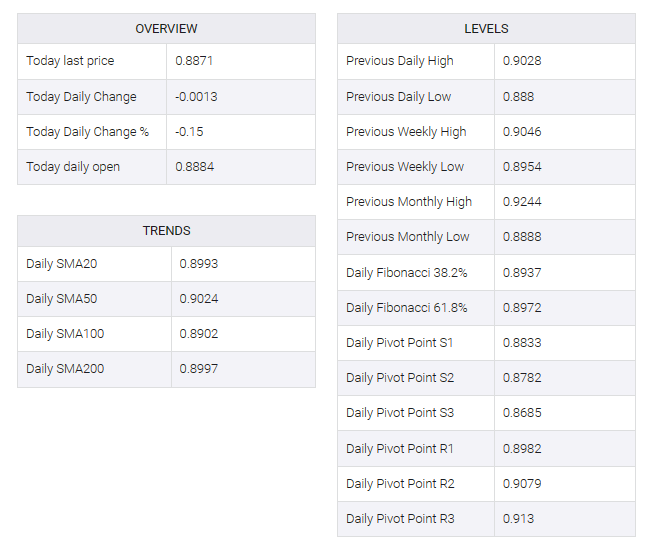
USD/CHF: OTHER TECHNICAL LEVELS TO WATCH