-
The USD/JPY is soaring during the week by almost 1.50%.
-
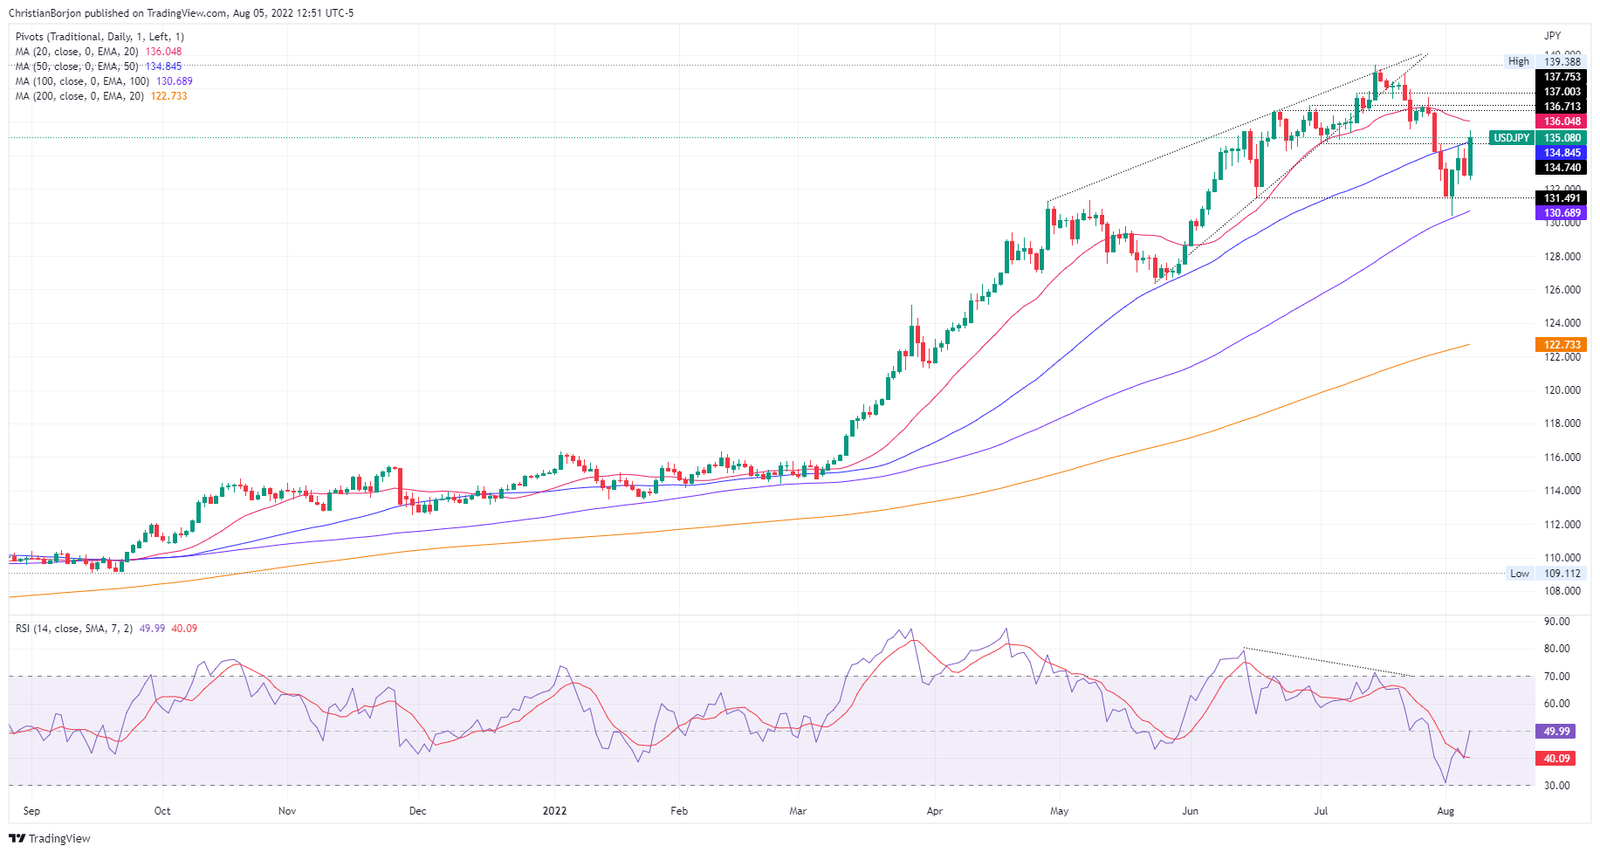
A bullish-engulfing candle pattern on the daily chart opens the door to further gains.
-
In the near term, a pullback towards 134.00 is on the cards.
USD/JPY rose for the third time in the week, hitting a fresh weekly high of 135.50, spurred by positive US jobs data released on Friday, which triggered a knee-jerk reaction of about 200 pips, from around 133.07 to its aforementioned weekly high of 135.06, USD/ JPY gained 1.66%.
USD/JPY Price Analysis: Technical outlook
Friday’s price action in USD/JPY shows that the major has formed a huge bullish-engulfing candle pattern, which means buying pressure is building. At the same time, the exchange rate sits above the 50-day EMA at 134.84, which could be decisively broken. Paving the way towards the 20-day EMA at 136.04. It’s worth noting that buyers are gathering momentum, as shown by the Relative Strength Index (RSI), about to cross the 50-center line, another reason for sellers to get out of the way after buyers regain control.
Therefore, the USD/JPY’s first resistance would be the 135.00 figure, followed by the 20-day EMA at 136.04, and then the June 22 daily high at 136.71.