-
USD/JPY holds above the 50- and 100-hour EMAs with an upward slope.
-
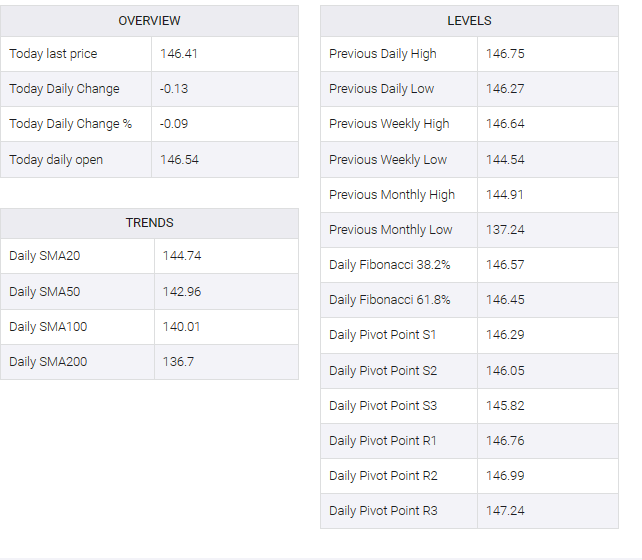
A Year-To-Date (YTD) high of 146.75 will be the first resistance level for the pair.
-
The initial contention for USD/JPY is located at 145.80.
The USD/JPY pair oscillated in a narrow range around 146.42 during early European trading hours on Tuesday. Market participants prefer to wait on the sidelines before the release of US CB Consumer Confidence and JOLTS job openings for July later in the North American session.
Also, Japan’s unemployment rate rose to 2.7% in July from 2.5% in June, according to the latest figures from the Bureau of Statistics. The number rose for the first time in four months and put pressure on the Bank of Japan (BoJ) and the government. However, traders are wary of buying bets for fear of the BoJ’s FX intervention.
Technically, the USD/JPY pair stands above the 50- and 100-hour exponential moving averages (EMAs) with an upward slope, which means the path of least resistance to the upside for the major pair.
The immediate resistance level for USD/JPY appears at a year-to-date (YTD) high of 146.75. Any meaningful follow-through buying would see a rally to the boundary of the Bollinger Bands and a psychological round mark in the 146.90-147.00 region. Further north, the next barrier to watch for USD/JPY lies at 147.55 (a November 2022 high), followed by 148.00 (a round figure).
On the downside, the primary resistance for the major pair is located at 145.80 (50-hour EMA). The next resistance level appears near a lower limit at 145.55 in Bollinger Bands. Any intraday pullback below the latter would reveal the next negative stop at 145.05 (100-hour EMA) and finally 144.55 (August 23 low).
It’s worth noting that the Relative Strength Index (RSI) stands in bullish territory above 50, which indicates that the upside momentum has been activated for the time being.
USD/JPY four-hour chart

USD/JPY