-
USD/JPY trades around 149.00 followed by 23.6% Fibonacci retracement.
-
Technical indicators suggest a bearish sentiment to navigate the support region around 146.50.
-
150.00 psychological level could be the resistance, followed by the nine-day EMA.
USD/JPY continued to trade at six-week lows, extending losses near 148.90 in the early European session on Monday. The 148.50 key level appears as immediate support aligned with the 23.6% Fibonacci retracement at 148.49.
The 14-day relative strength index (RSI) below the 50 level signals bearish sentiment, which could motivate bears in the USD/JPY pair to navigate to the support zone near the 146.50 key level, followed by the 38.2% Fibonacci retracement at 146.37.
Additionally, the Moving Average Convergence Divergence (MACD) line positioned above the centerline shows divergence below the signal line, usually suggesting a bearish momentum in the market. This configuration indicates that the short-term moving average (MACD line) is moving farther downward than the long-term moving average (signal line).
On the upside, the psychological level at 150.00 could be the key barrier, aligned with the nine-day exponential moving average (EMA) at 150.34. A move above the latter could support the USD/JPY pair revisiting the previous week’s high of 151.90.
USD/JPY: Daily Chart

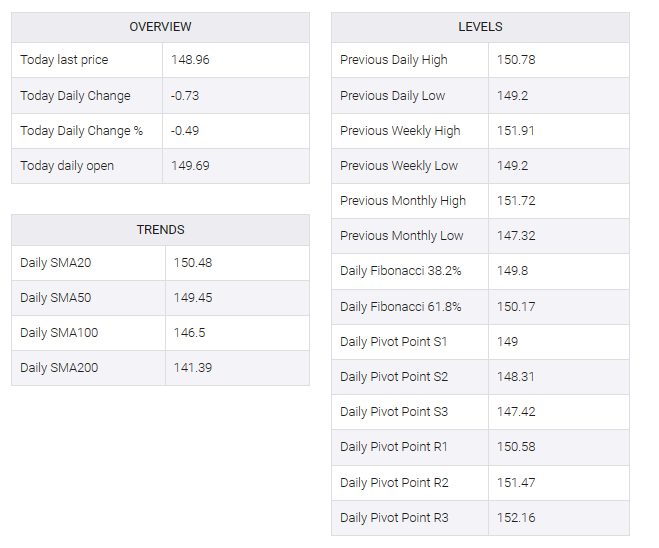
USD/JPY: ADDITIONAL LEVELS TO WATCH