-
USD/JPY portrays bearish chart formation at the highest levels in six months.
-
Downbeat MACD signals also lure Yen pair bears, 100-HMA, 200-HMA act as extra checks for sellers.
-
Bulls need validation from 139.40 to retake control.
USD/JPY grinded below 139.00, offering near 138.40 in Wednesday’s European session.
The yen pair rose to new highs since November 2022 before posting a bearish close the previous day. In doing so, major currency pairs depict a one-week rising wedge bearish chart formation.
Not only the bearish pattern, the MACD signal and failure to hold on to multi-day highs also tempt USD/JPY sellers.
However, the 100-hour moving average (HMA) level around 138.30 limits the yen pair’s immediate downside, with a break highlighting the confirmation point of the stated wedge, i.e. the lower line around 138.00.
After that, a sharp decline towards the 200-HMA around 137.20 cannot be ruled out. It should be noted that the rising wedge confirmation points to the 136.00 round figure as a theoretical target.
Alternatively, the top line of the aforementioned wedge, near the 139.00 round figure by press time, limits immediate USD/JPY recovery. The yen pair is also likely to challenge buyers near the July 2022 high of 139.40.
Even if the yen pair is able to cross the 139.40 barrier, the 140.00 round figure could tempt buyers.
Overall, USD/JPY bulls appear to run out of steam but the sellers wait for clear signals.
USD/JPY: Hourly chart
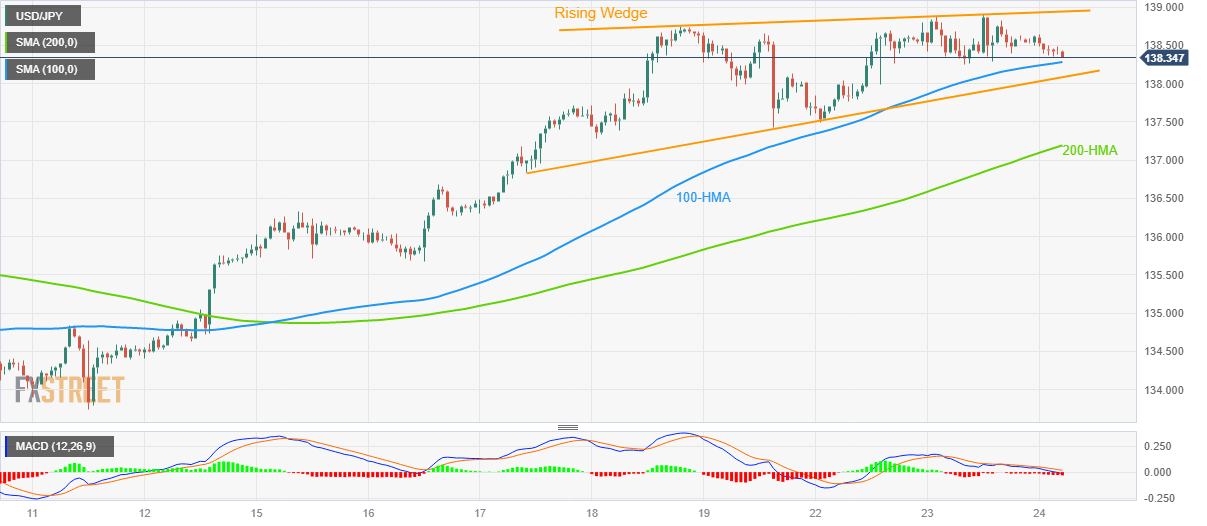
Trend: Pullback expected
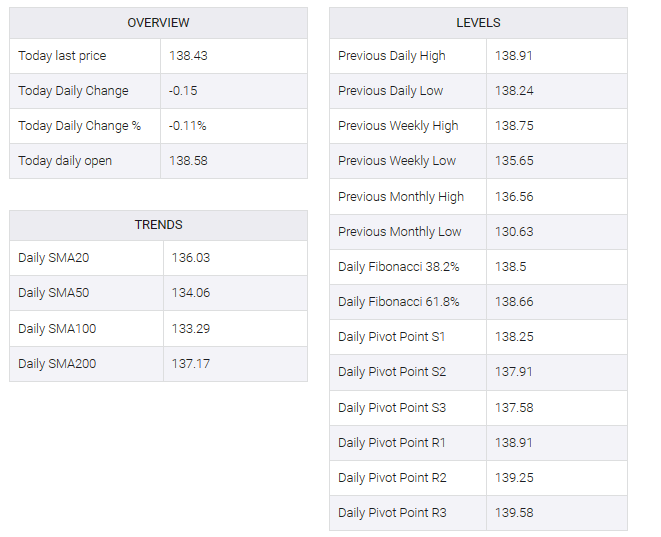
ADDITIONAL IMPORTANT LEVELS